

Question: Will this help? Financial Analysis Review the balance sheet and income statement in the company's 2017 and 2018 Annual Report. Complete the ratio calculations and
Will this help?
Financial Analysis
Review the balance sheet and income statement in the company's 2017 and 2018 Annual Report. Complete the ratio calculations and analysis
Create a short (one to two sentence) bullet point statement for each ratio interpreting what the ratio calculation result indicates about their performance.
Complete the table below (scroll down):
| Ratio | 2018 | 2017 | Interpretation do not define. Interpret |
| Current Ratio | |||
| Quick Ratio | |||
| Debt Equity Ratio | |||
| Inventory Turnover Ratio | |||
| Receivables Turnover Ratio | |||
| Total Assets Turnover Ratio | |||
| Profit Margin (Net Margin) Ratio | |||
| Return on Assets Ratio |
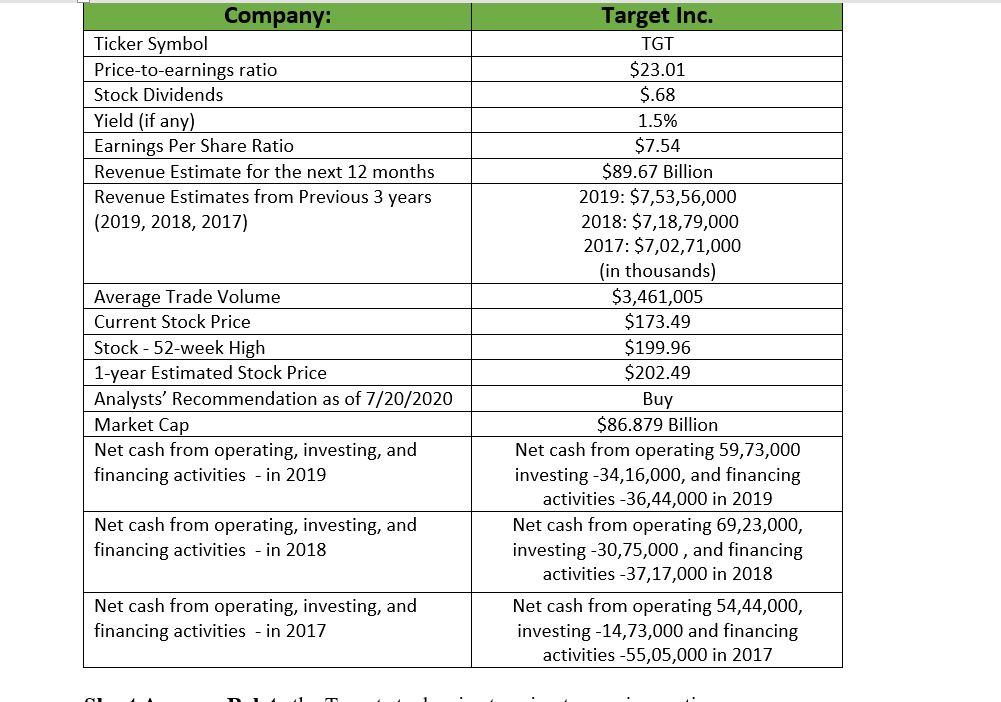
Company: Ticker Symbol Price-to-earnings ratio Stock Dividends Yield (if any) Earnings Per Share Ratio Revenue Estimate for the next 12 months Revenue Estimates from Previous 3 years (2019, 2018, 2017) Average Trade Volume Current Stock Price Stock - 52-week High 1-year Estimated Stock Price Analysts' Recommendation as of 7/20/2020 Market Cap Net cash from operating, investing, and financing activities - in 2019 Target Inc. TGT $23.01 $.68 1.5% $7.54 $89.67 Billion 2019: $7,53,56,000 2018: $7,18,79,000 2017: $7,02,71,000 (in thousands) $3,461,005 $173.49 $199.96 $202.49 Buy $86.879 Billion Net cash from operating 59,73,000 investing -34,16,000, and financing activities -36,44,000 in 2019 Net cash from operating 69,23,000, investing -30,75,000, and financing activities -37,17,000 in 2018 Net cash from operating 54,44,000, investing -14,73,000 and financing activities -55,05,000 in 2017 Net cash from operating, investing, and financing activities - in 2018 Net cash from operating, investing, and financing activities - in 2017 Company: Ticker Symbol Price-to-earnings ratio Stock Dividends Yield (if any) Earnings Per Share Ratio Revenue Estimate for the next 12 months Revenue Estimates from Previous 3 years (2019, 2018, 2017) Average Trade Volume Current Stock Price Stock - 52-week High 1-year Estimated Stock Price Analysts' Recommendation as of 7/20/2020 Market Cap Net cash from operating, investing, and financing activities - in 2019 Target Inc. TGT $23.01 $.68 1.5% $7.54 $89.67 Billion 2019: $7,53,56,000 2018: $7,18,79,000 2017: $7,02,71,000 (in thousands) $3,461,005 $173.49 $199.96 $202.49 Buy $86.879 Billion Net cash from operating 59,73,000 investing -34,16,000, and financing activities -36,44,000 in 2019 Net cash from operating 69,23,000, investing -30,75,000, and financing activities -37,17,000 in 2018 Net cash from operating 54,44,000, investing -14,73,000 and financing activities -55,05,000 in 2017 Net cash from operating, investing, and financing activities - in 2018 Net cash from operating, investing, and financing activities - in 2017
Step by Step Solution
There are 3 Steps involved in it

Get step-by-step solutions from verified subject matter experts