

Question: Wilson Distributors Inc. - Ratio Analysis Case Study - Spring 2021 Wilson Distributors, Inc. is a distributor of Miller beer as well as several lesser-known
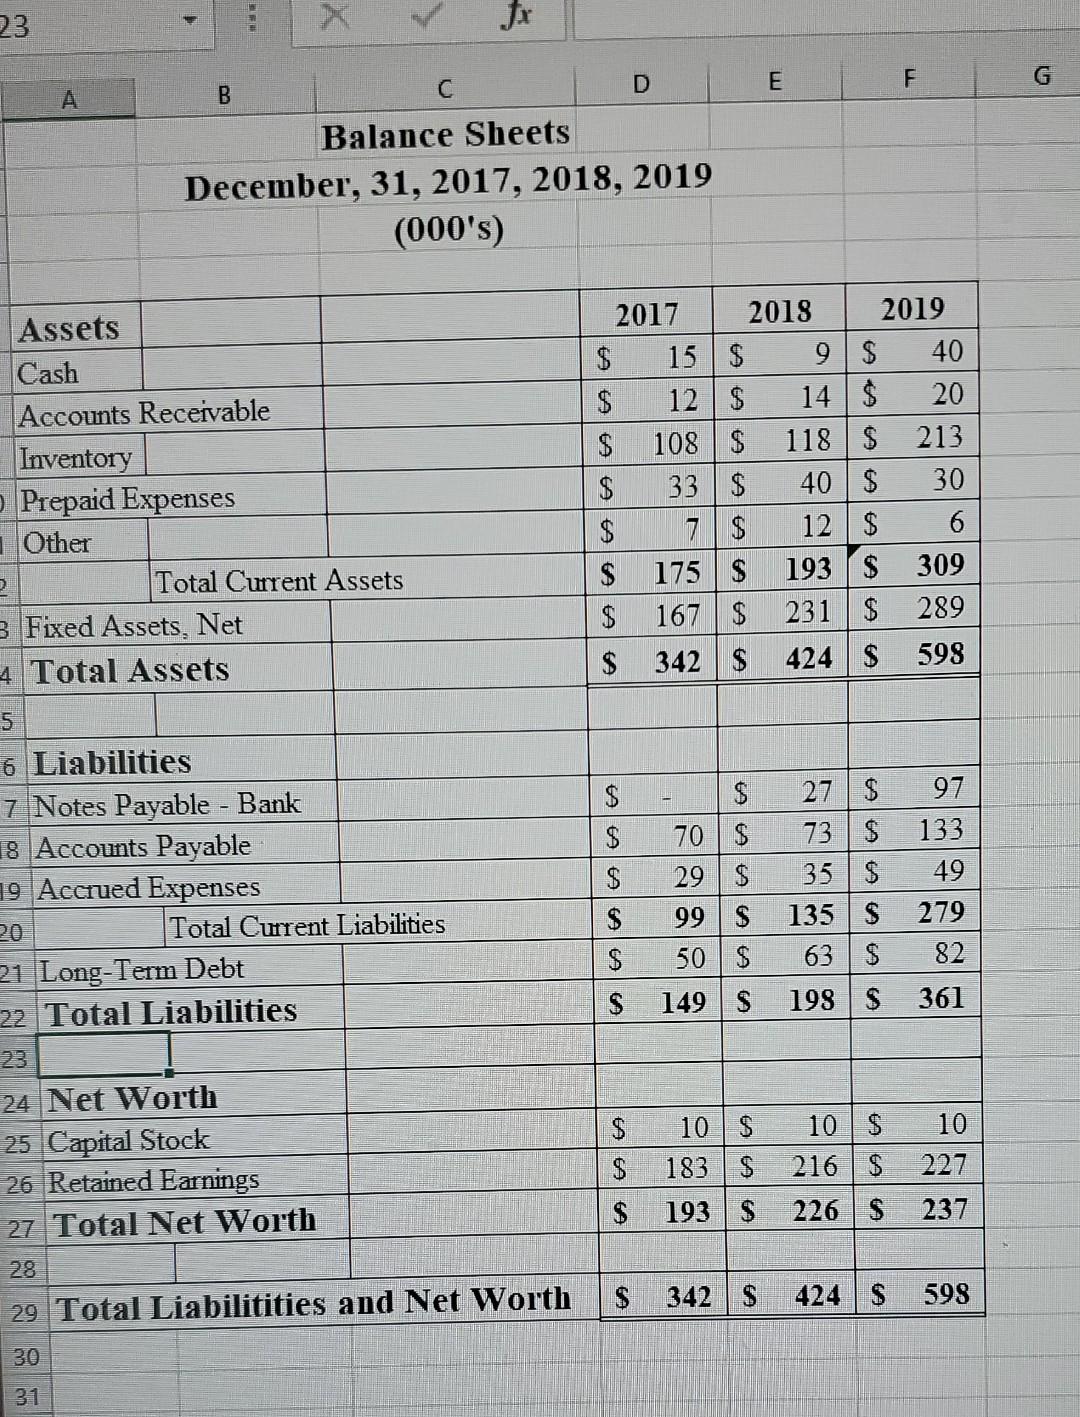
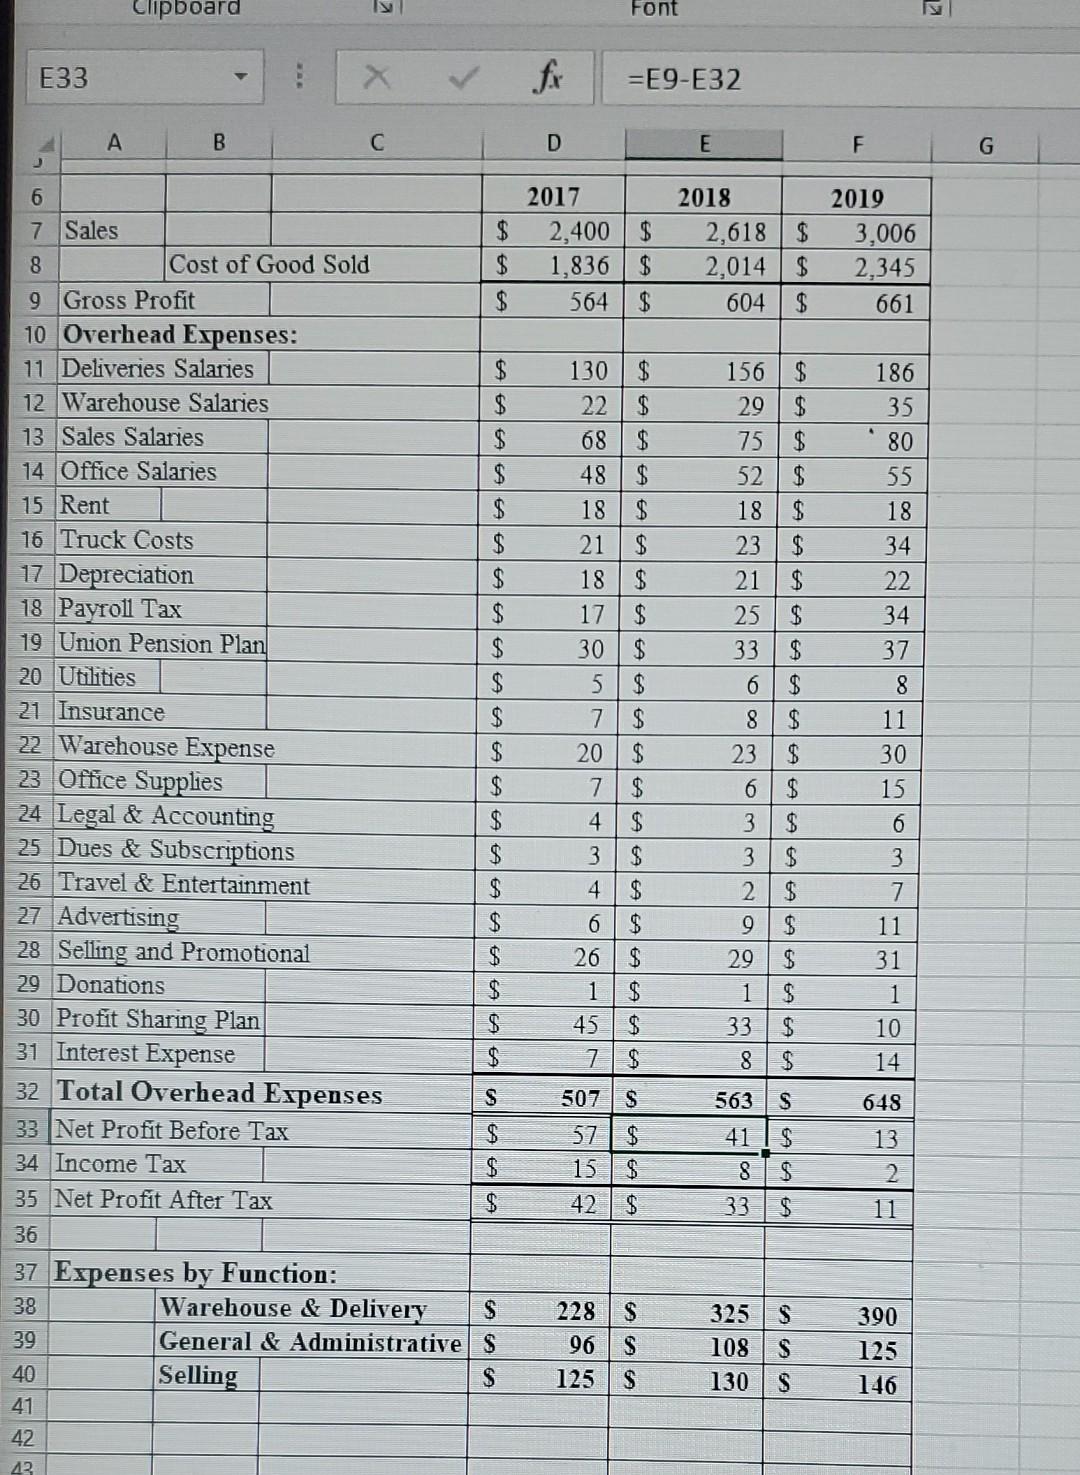
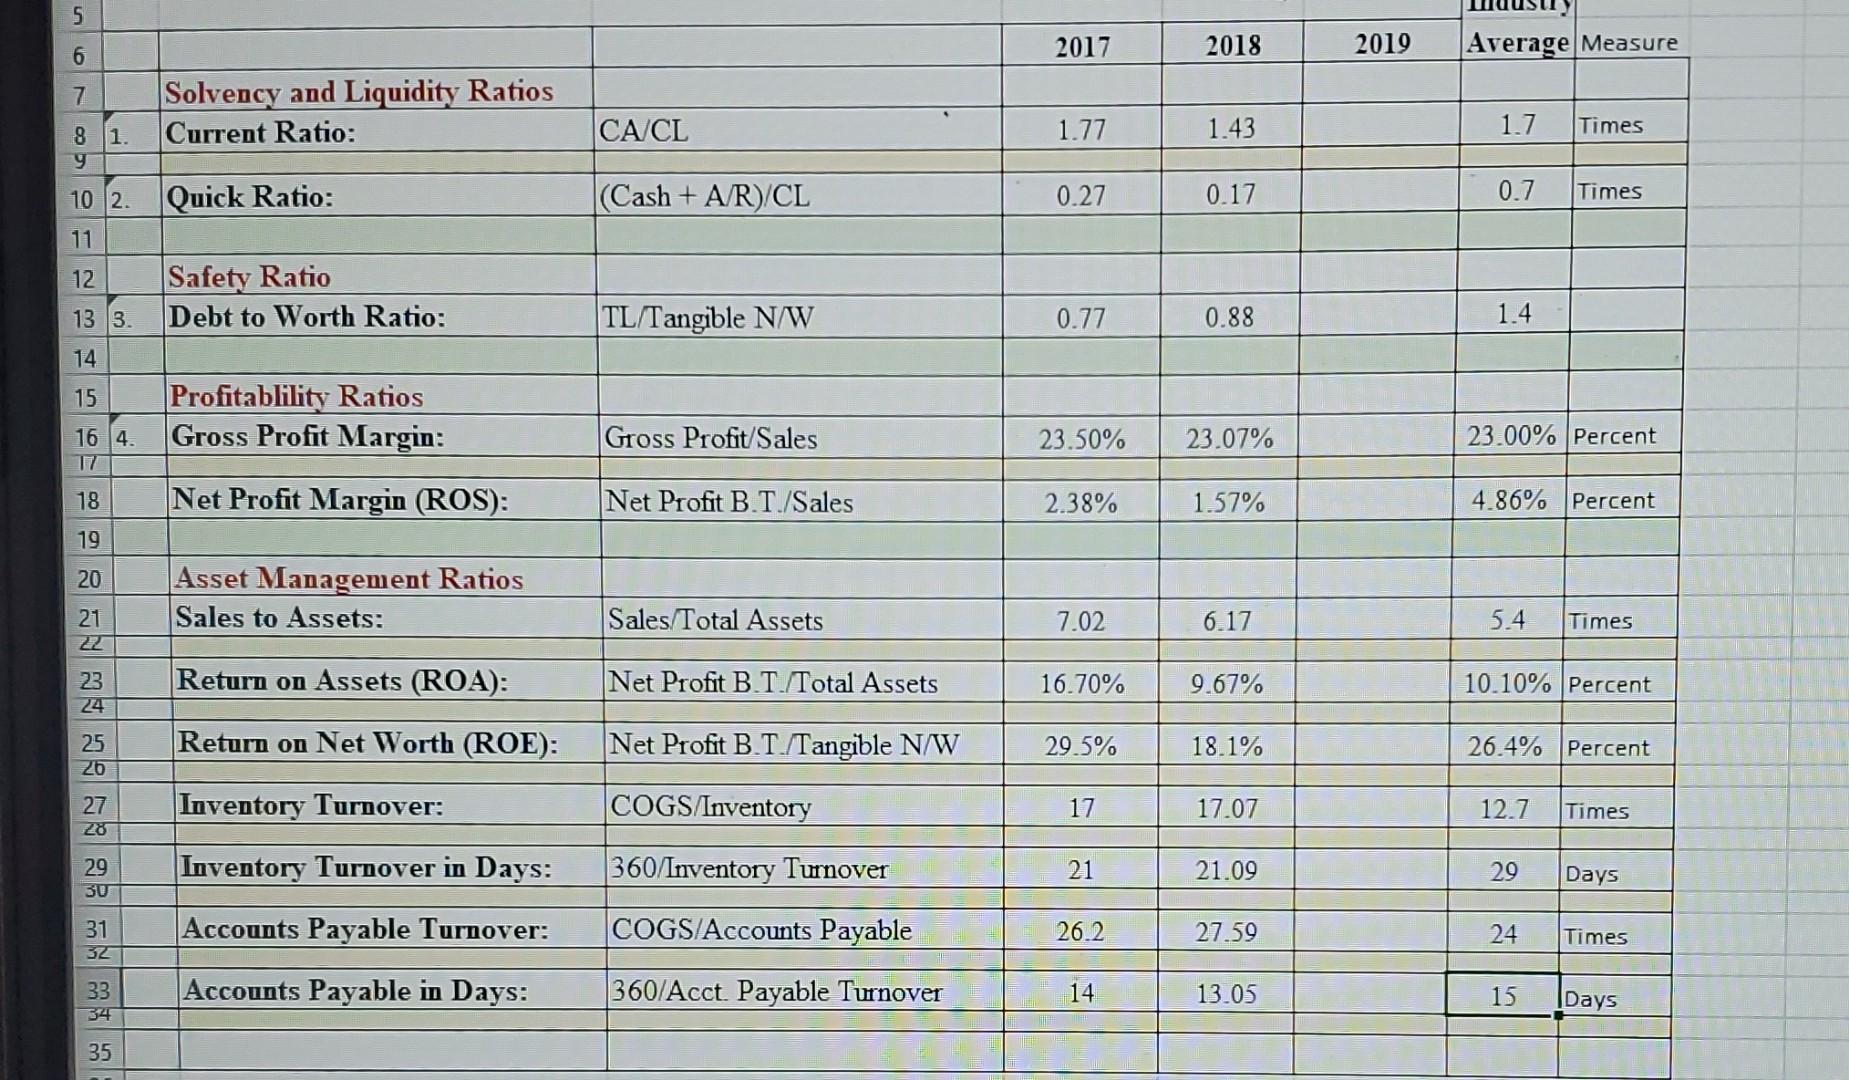
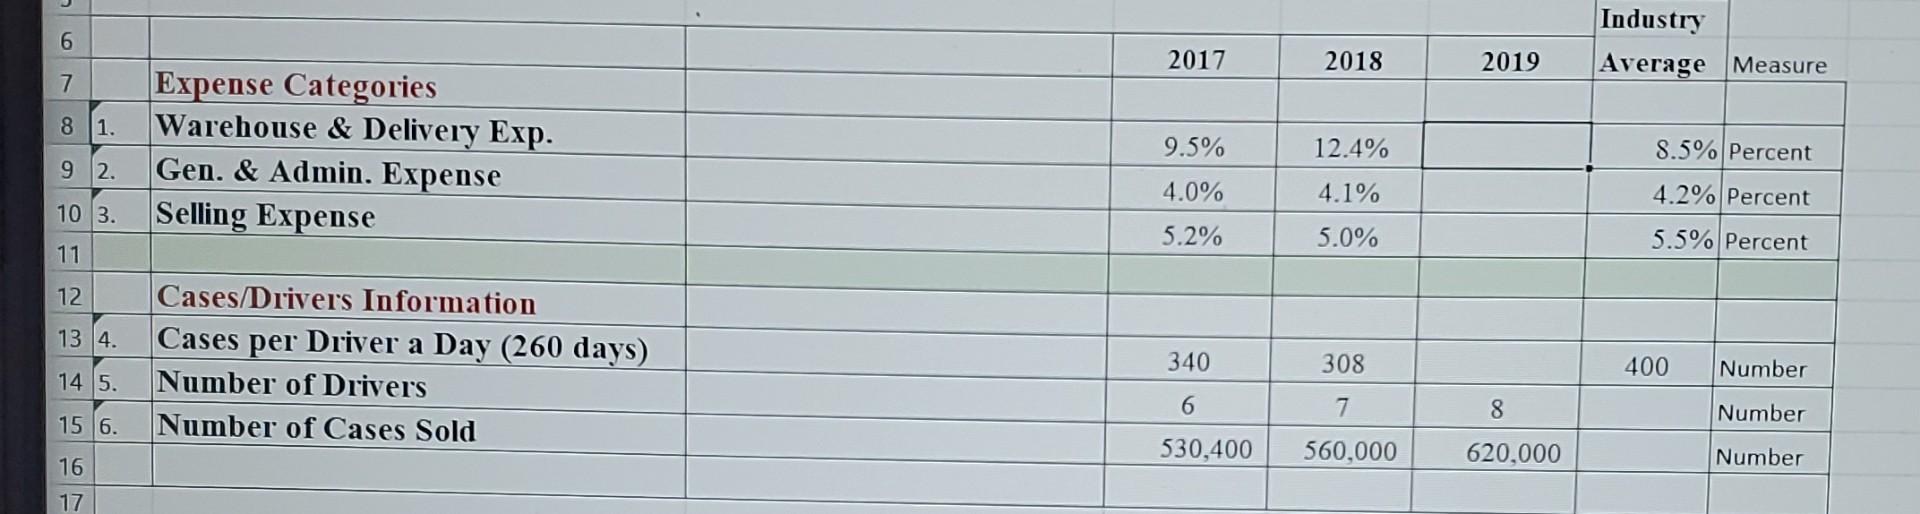
Wilson Distributors Inc. - Ratio Analysis Case Study - Spring 2021 Wilson Distributors, Inc. is a distributor of Miller beer as well as several lesser-known brands. The father owns the business, but he has been gradually turning it over to his son the last few years. There are 20 employees including Father and Son The current situation contains both good and bad news. Good news: Sales have increased $400,000 (15%) in the last year and the son is very proud of this accomplishment Bad news: The Company is behind on its payments to the brewery (terms net 15 days) and the brewery has demanded payment in full and put future payments on a COD basis. Required 1 Look at the Balance Sheet and Income Statement accounts and note any trends or concerns you may see. 2. Complete the ratios on the Ratio Analysis Worksheet 3 Do a trend analysis on the ratios you have computed. 4 Compare the ratios to industry averages and red flag any problems that you see. 5. Review the "cause and effect" analysis on the problem ratios. 6. Open the "Internal Bank Load Review file and fill out the form 7. Re-attached the filled-out form in Blackboard or email the form 23 D E F G C A B Balance Sheets December, 31, 2017, 2018, 2019 (000's) Assets Cash Accounts Receivable Inventory Prepaid Expenses 1 Other 2 Total Current Assets 3 Fixed Assets, Net 4 Total Assets 2017 2018 2019 $ 15$ 9 $ 40 $ 12$ 14$ 20 $ 108$ 118 $ 213 $ 33 $ 40 $ 30 $ 7 $ 12$ 6 $ 175 $ 193S 309 $ 167 $ 231 $ 289 $ 342 $ 424 $ 598 IA 5 $ $ 133 6 Liabilities 7 Notes Payable - Bank 18 Accounts Payable 19 Accued Expenses Total Current Liabilities 21 Long-Term Debt 22 Total Liabilities $ 70$ 29 $ 99 S 50 $ 149S 27 $ 97 73 $ 35$ 49 135s 279 63 S 82 198S 361 $ 20 ] $ $ 23 10 24 Net Worth 25 Capital Stock 26 Retained Earnings 27 Total Net Worth $ $ 10$ 10 $ 183 216 | $ 193 $ 226 S A 227 237 $ 28 $ 342 $ 424$ 598 29 Total Liabilitities and Net Worth 30 31 Clipboard iv Font 2 E33 fx =E9-E32 A B D C E F . G 6 2017 2,400 $ 1,836 $ 564 $ 2018 2,618 2,014 604 $ $ 2019 3,006 2,345 661 AEA $ Olo AAAAAAAAA Nu NU Woo Ao lol A A A A A A A III-8 0 0 2 olimon 186 35 80 55 18 34 22 34 130$ 22 68 48 $ 18 21 18 17 30 5 $ 7 $ 20 7 $ 4 $ 3 $ 4 $ 6 $ 26 to tutta 7 Sales $ 8 Cost of Good Sold $ 9 Gross Profit $ 10 Overhead Expenses: 11 Deliveries Salaries $ 12 Warehouse Salaries $ 13 Sales Salaries $ 14 Office Salaries $ 15 Rent $ 16 Truck Costs $ 17 Depreciation $ 18 Payroll Tax 19 Union Pension Plan $ 20 Utilities $ 21 Insurance $ 22 Warehouse Expense $ 23 Office Supplies $ 24 Legal & Accounting $ 25 Dues & Subscriptions $ 26 Travel & Entertainment $ 27 Advertising $ 28 Selling and Promotional $ 29 Donations $ 30 Profit Sharing Plan 31 Interest Expense 32 Total Overhead Expenses S 33 Net Profit Before Tax 34 Income Tax $ 35 Net Profit After Tax $ 36 37 Expenses by Function: 38 Warehouse & Delivery $ 39 General & Administrative S 40 Selling S 41 42 42. 156 29 75 52 $ 18 23 21 $ 25 33 6 $ 8 $ 23 $ 6 $ 3 $ 3 $ 2 $ 9 $ 29 $ 1 $ 33 $ 8 $ 37 8 11 30 15 ACAG 6 3 7 11 ||-| 31 1 10 14 AGA 45 $ $ lo 563 S 648 66 GA 41 507 S 57 $ 15 $ 42 $ 13 2 8 $ 33 $ 11 228 96 125 S S S 325 S 108 S 130 S 390 125 146 5 6 2017 2018 2019 Average Measure 7 Solvency and Liquidity Ratios Current Ratio: CA/CL 1.77 1.43 1.7 Times 8 1. g 10 2. Quick Ratio: (Cash + A/R)/CL 0.27 0.17 0.7 Times 11 12 Safety Ratio Debt to Worth Ratio: 13 3 TL/Tangible N/W 0.77 0.88 1.4 14 15 Profitablility Ratios Gross Profit Margin: 16 4. Gross Profit/Sales 23.50% 23.07% 23.00% Percent 18 Net Profit Margin (ROS): Net Profit B.T./Sales 2.38% 1.57% 4.86% Percent 19 20 Asset Management Ratios Sales to Assets: Sales/Total Assets 21 22 7.02 6.17 5.4 Times 23 24 Return on Assets (ROA): Net Profit B.T./Total Assets 16.70% 9.67% 10.10% Percent 26.4 % 25 26 Return on Net Worth (ROE): Net Profit B.T./Tangible N/W 29.5% 18.1% 26.4% Percent 27 28 Inventory Turnover: COGS/Inventory 17 17.07 12.7 Times 29 30 Inventory Turnover in Days: 360/Inventory Turnover 21 21.09 29 Days 31 Accounts Payable Turnover: COGS/Accounts Payable 26.2 27.59 24 Times 32 33 34 Accounts Payable in Days: 360/Acct. Payable Turnover 14 13.05 15 Days 35 6 Industry Average Measure 2017 2018 2019 7 8 1. Expense Categories Warehouse & Delivery Exp. Gen. & Admin. Expense Selling Expense 9.5% 12.4% 8.5% Percent 9 2. 4.0% 4.1% 4.2% Percent 10 3. 5.2% 5.0% 5.5% Percent 11 12 13 4. Cases/Drivers Information Cases per Driver a Day (260 days) Number of Drivers Number of Cases Sold 340 308 400 Number 14 5. 6 7 8 Number 15 6. 530,400 560,000 620,000 16 Number 17
Step by Step Solution
There are 3 Steps involved in it
To analyze the financial situation and address the requirements of the Wilson Distributors Inc case study we will break down the key points based on the provided financial data Heres a structured anal... View full answer

Get step-by-step solutions from verified subject matter experts