

Question: With all three methods, the output should look like the following table: Make sure you are comfortable with all three methods. We can now answer
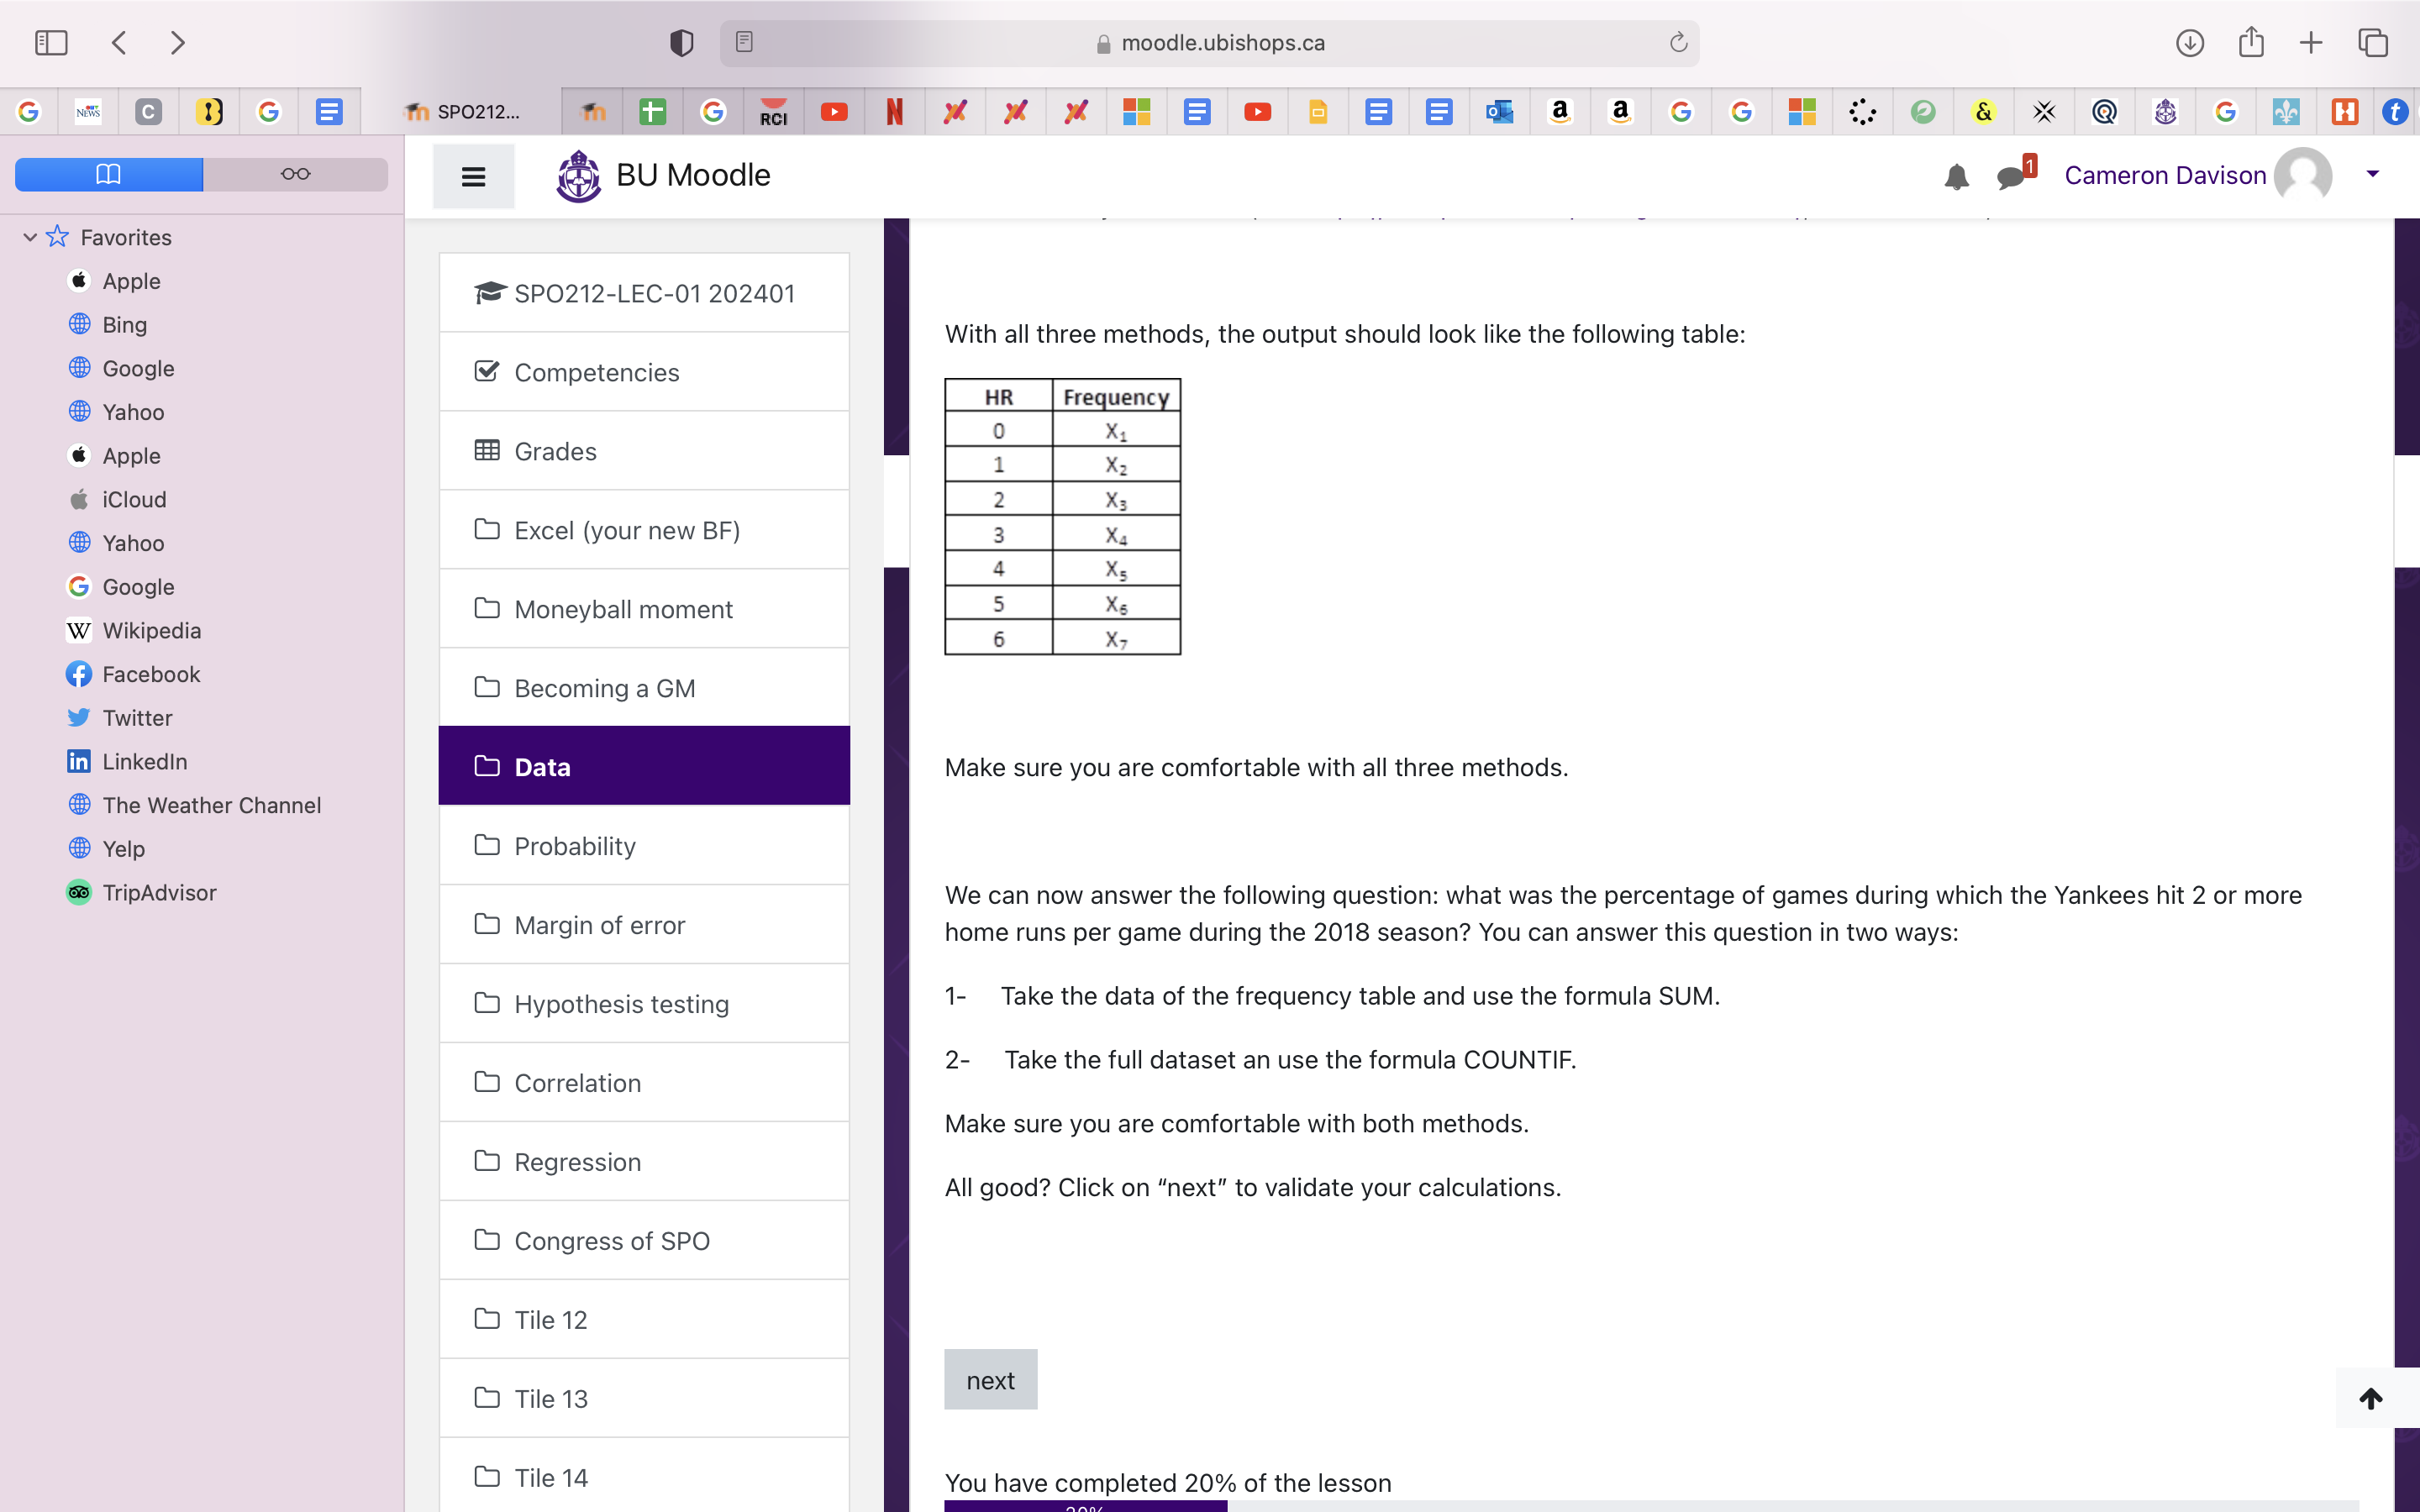
With all three methods, the output should look like the following table:
Make sure you are comfortable with all three methods.
We can now answer the following question: what was the percentage of games during which the Yankees hit or more
home runs per game during the season? You can answer this question in two ways:
Take the data of the frequency table and use the formula SUM.
Take the full dataset an use the formula COUNTIF.
Make sure you are comfortable with both methods.
All good? Click on "next" to validate your calculations.
You have completed of the lesson
Step by Step Solution
There are 3 Steps involved in it
1 Expert Approved Answer
Step: 1 Unlock

Question Has Been Solved by an Expert!
Get step-by-step solutions from verified subject matter experts
Step: 2 Unlock
Step: 3 Unlock