

Question: with detailed solution handwritten okay ill rate please answer all 2 . Get a simple random sample of 10 students from 3. Compute the following
with detailed solution handwritten okay ill rate please answer all
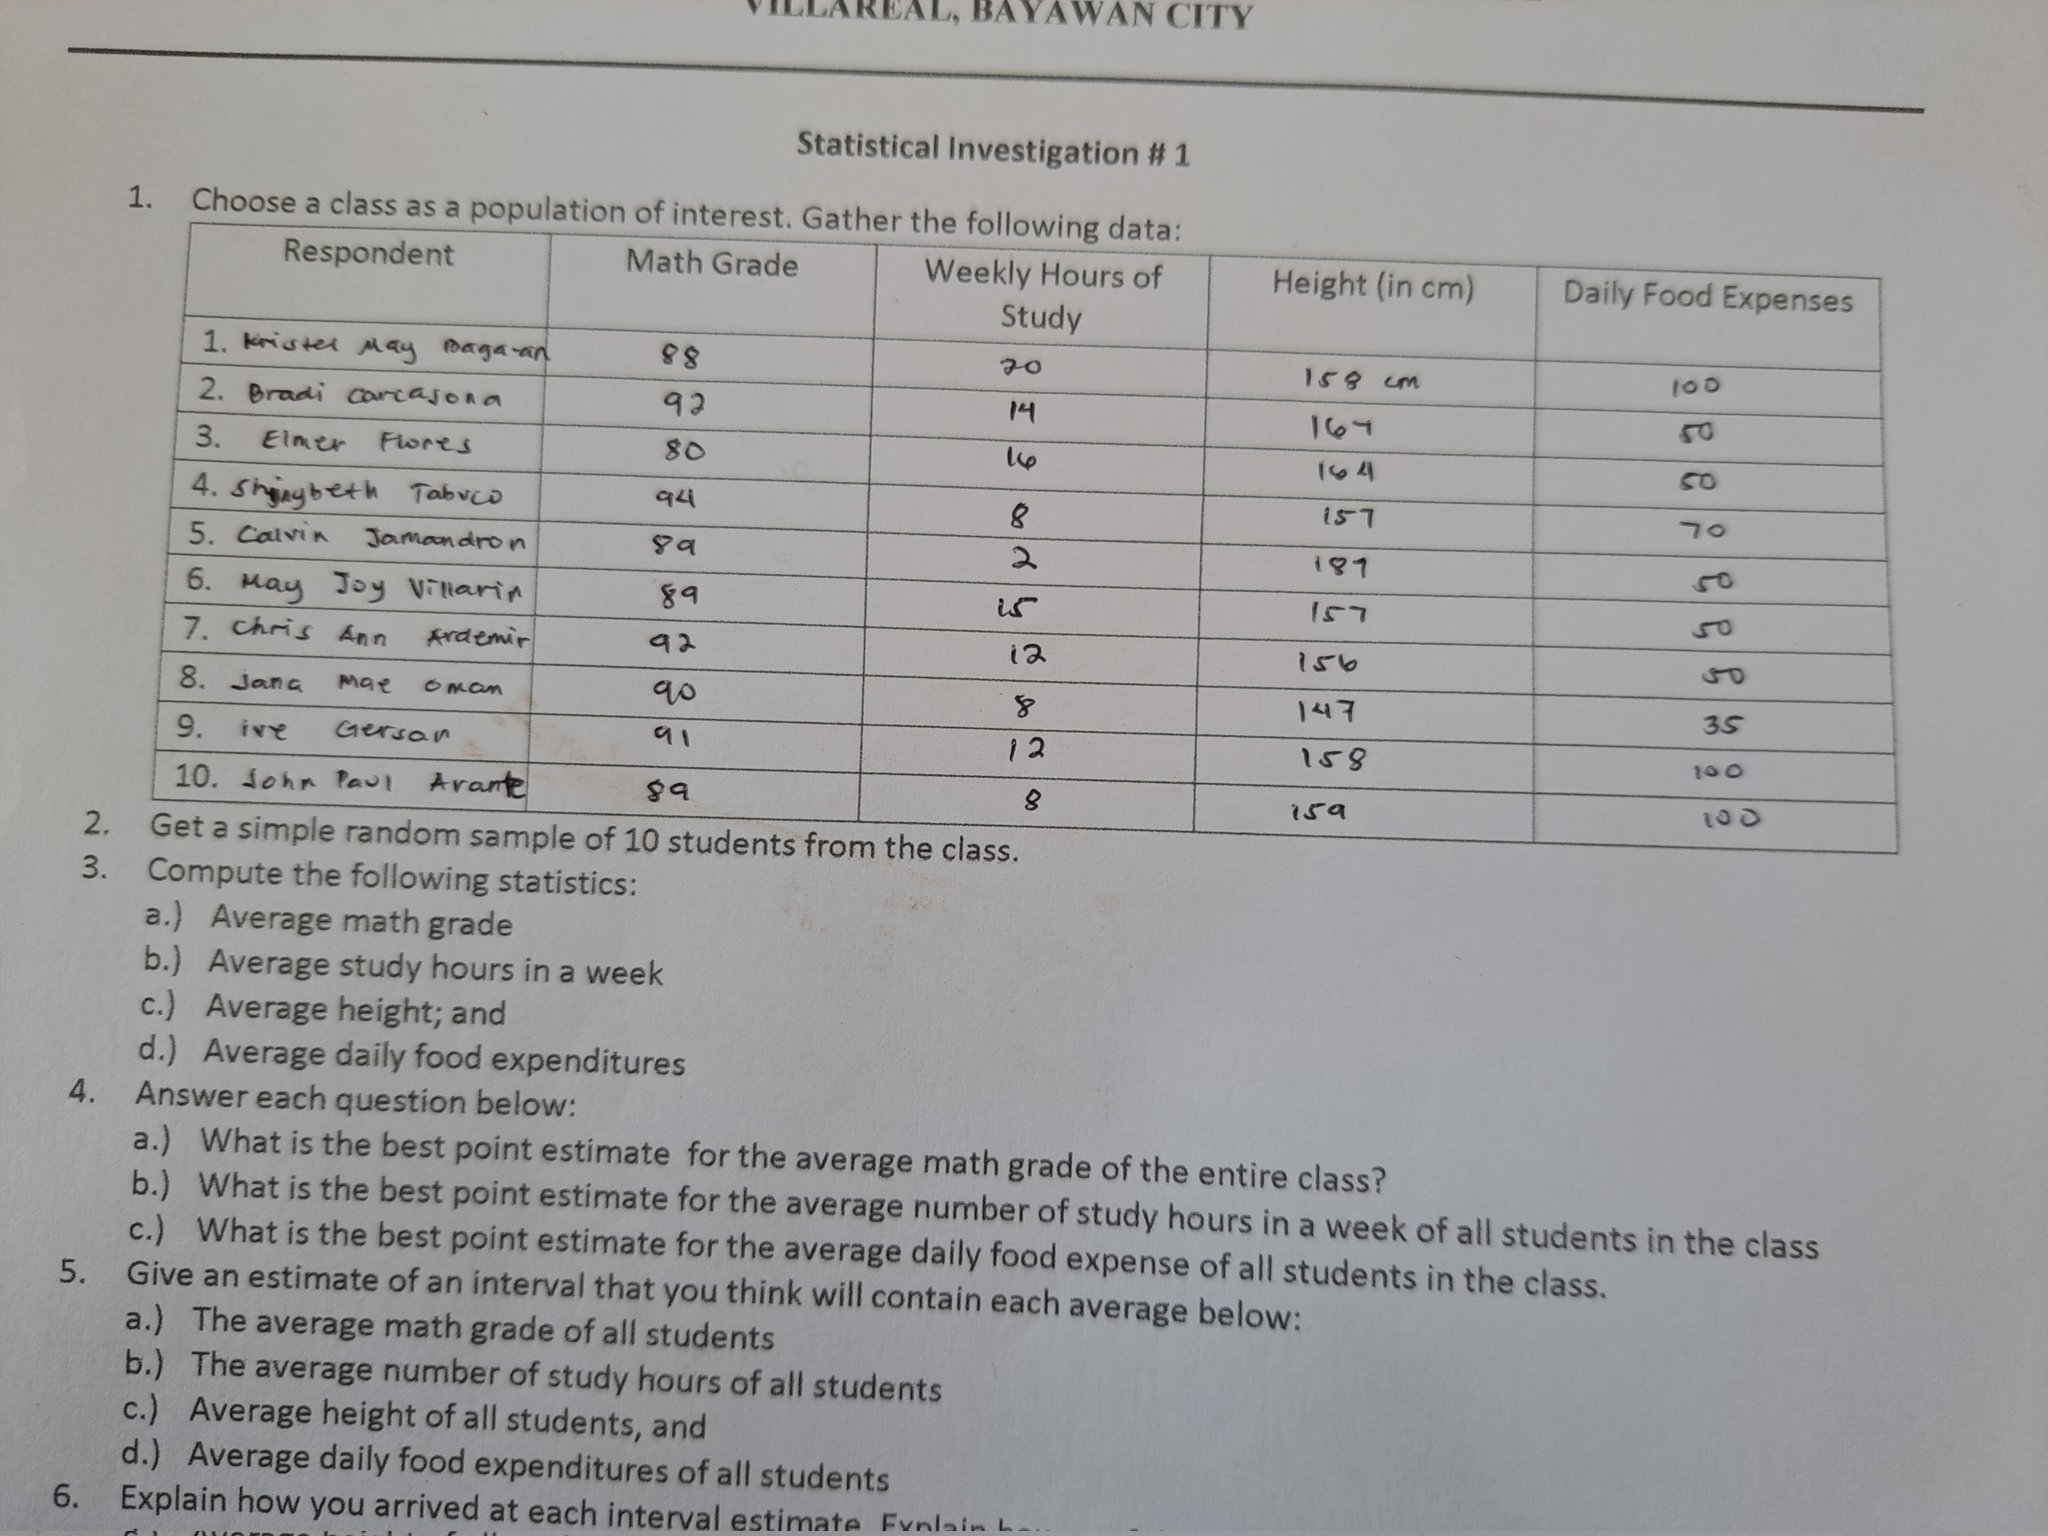
2 . Get a simple random sample of 10 students from 3. Compute the following statistics: a.) Average math grade b.) Average study hours in a week c.) Average height; and d.) Average daily food expenditures 4. Answer each question below: ) What is the best point estimate for the average math grade of the entire class? b.) What is the best point estimate for the average number of study hours in a week of all students in the class What is the best point estimate for the average daily food expense of all students in the class. 5. Give an estimate of an interval that you think will contain each average below: a.) The average math grade of all students b.) The average number of study hours of all students c.) Average height of all students, and d.) Average daily food expenditures of all students 6. Explain how you arrived at each interval estimate. Explain how confident you are that those interval estimates contains the true average or population means . Collect interval estimates from the class, plot them and observe variations in the point of interval estimates 8. Calculate the following population means using the population data from the entire class. a.) Average math grade of all students b.) Average number of study hours of all students c.) Average height of all students, and d.) Average daily food expenditures of all students 9. Compute the absolute values of the differences between the point of estimates and the population means that you have calculated. What do you observe? 10. Check if the interval estimates contains the population means that you calculated. What can you conclude? 11. Can you conclude that your estimates are reliable in estimating the population means? Why or Why not? ENTOR AL Address: Barangay Villareal, Bayawan City Contact Number: (035) 430-0622/ 527-4162AWAN CITY Statistical Investigation # 1 1. Choose a class as a population of interest. Gather the following data: Respondent Math Grade Weekly Hours of Height (in cm) Daily Food Expenses Study 1. kristel May Baga-an 8 8 20 158 cm 100 2. Bradi carcasona 92 14 50 3. Elmer Flores 80 50 4. Shingbeth Tabuco 94 8 157 70 5. Calvin Jamandron 2 187 50 6. May Joy Villarin 89 is 157 50 7. Chris Ann Ardemir 92 12 156 8. Jana Mae oman 8 147 35 9 . ive Gerson 91 12 158 10 0 10. John Paul Arante 89 8 159 100 2 . Get a simple random sample of 10 students from the class. 3. Compute the following statistics: a.) Average math grade b.) Average study hours in a week c.) Average height; and d.) Average daily food expenditures 4. Answer each question below: a.) What is the best point estimate for the average math grade of the entire class? b.) What is the best point estimate for the average number of study hours in a week of all students in the class c.) What is the best point estimate for the average daily food expense of all students in the class. 5. Give an estimate of an interval that you think will contain each average below: a.) The average math grade of all students b.) The average number of study hours of all students c.) Average height of all students, and d.) Average daily food expenditures of all students 6. Explain how you arrived at each interval estimate Funlain
Step by Step Solution
There are 3 Steps involved in it

Get step-by-step solutions from verified subject matter experts