

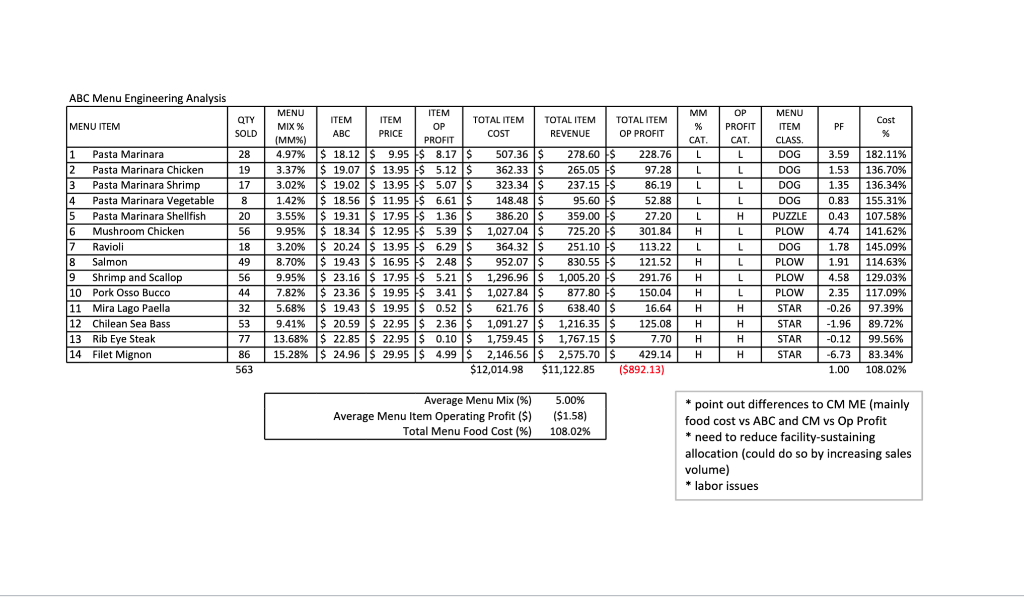
Question: With given information, how was last chart was calculated. Item ABC,Item Operating Profit, Total Item ABC Costs, Total Item Operating Profit, Profit Factor, ABC cost%
 With given information, how was last chart was calculated.
Item ABC,Item Operating Profit, Total Item ABC Costs, Total Item Operating Profit, Profit Factor, ABC cost%
Average Menu Item operating Profit, and Total menu food costs(%)
Thank you so much,
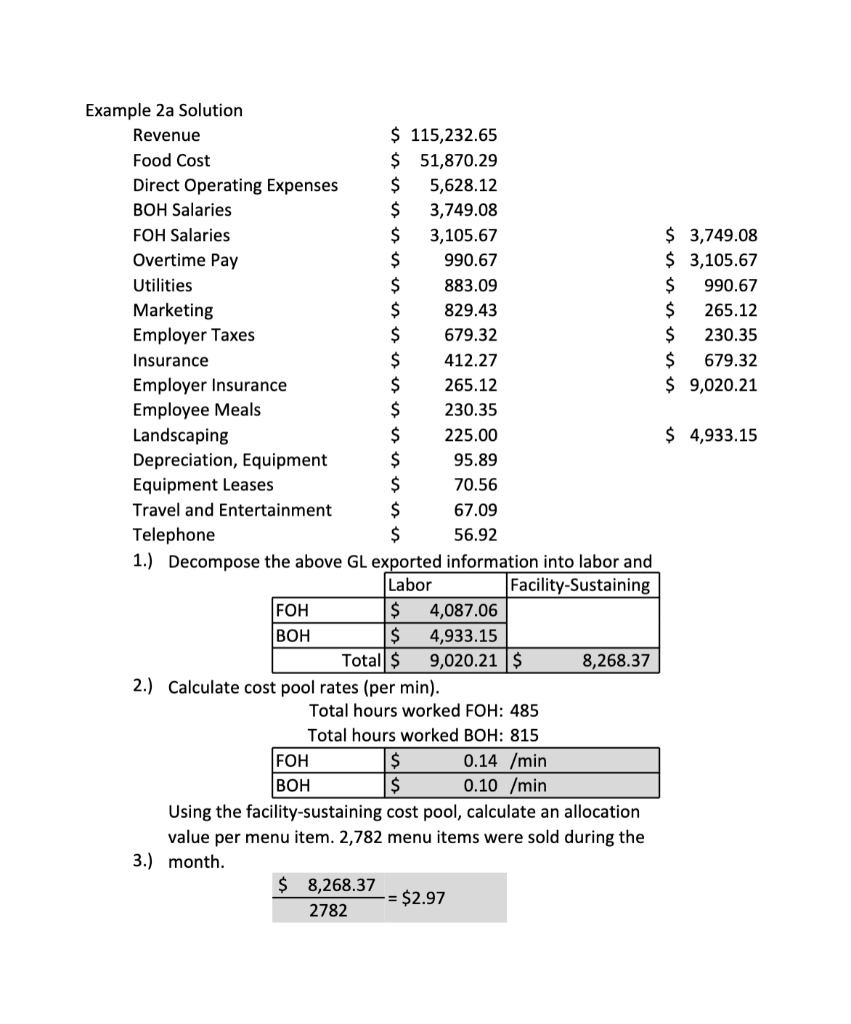
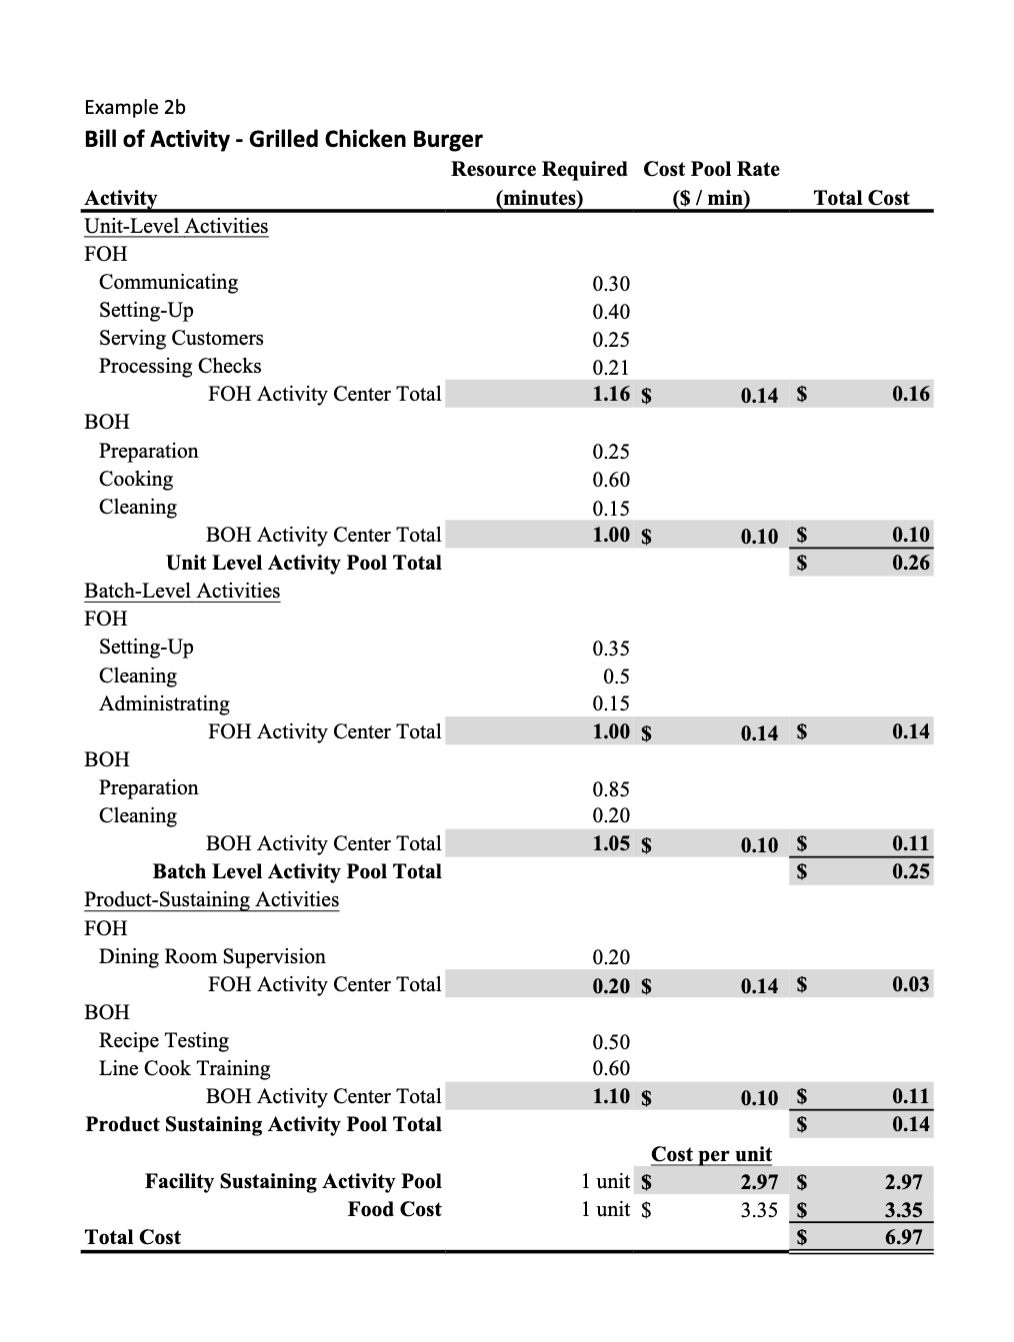
$ 3,749.08 $ 3,105.67 $ 990.67 $ 265.12 $ 230.35 $ 679.32 $ 9,020.21 $ 4,933.15 Example 2a Solution Revenue $ 115,232.65 Food Cost $ 51,870.29 Direct Operating Expenses $ 5,628.12 BOH Salaries $ 3,749.08 FOH Salaries $ 3,105.67 Overtime Pay $ 990.67 Utilities $ 883.09 Marketing $ 829.43 Employer Taxes $ 679.32 Insurance $ 412.27 Employer Insurance $ 265.12 Employee Meals $ 230.35 Landscaping $ 225.00 Depreciation, Equipment $ 95.89 Equipment Leases $ 70.56 Travel and Entertainment $ 67.09 Telephone $ 56.92 1.) Decompose the above GL exported information into labor and Labor Facility-Sustaining FOH $ 4,087.06 BOH $ 4,933.15 Total $ 9,020.21 $ 8,268.37 2.) Calculate cost pool rates (per min). Total hours worked FOH: 485 Total hours worked BOH: 815 FOH $ 0.14 /min BOH $ 0.10 /min Using the facility-sustaining cost pool, calculate an allocation value per menu item. 2,782 menu items were sold during the 3.) month. $ 8,268.37 -= $2.97 2782 1.16 $ Example 2b Bill of Activity - Grilled Chicken Burger Resource Required Cost Pool Rate Activity (minutes) ($ / min) Total Cost Unit-Level Activities FOH Communicating 0.30 Setting-Up 0.40 Serving Customers 0.25 Processing Checks 0.21 FOH Activity Center Total 0.14 $ 0.16 BOH Preparation 0.25 Cooking 0.60 Cleaning 0.15 BOH Activity Center Total 1.00 $ 0.10 $ 0.10 Unit Level Activity Pool Total $ 0.26 Batch-Level Activities FOH Setting-Up 0.35 Cleaning 0.5 Administrating 0.15 FOH Activity Center Total 1.00 $ 0.14 $ 0.14 BOH Preparation 0.85 Cleaning 0.20 BOH Activity Center Total 0.10 $ 0.11 Batch Level Activity Pool Total $ 0.25 Product-Sustaining Activities FOH Dining Room Supervision 0.20 FOH Activity Center Total 0.20 $ 0.14 $ 0.03 BOH Recipe Testing 0.50 Line Cook Training 0.60 BOH Activity Center Total 1.10 $ 0.10 $ 0.11 Product Sustaining Activity Pool Total $ 0.14 Cost per unit Facility Sustaining Activity Pool 1 unit $ 2.97 $ 2.97 Food Cost 1 unit $ 3.35 $ 3.35 Total Cost $ 6.97 1.05 $ ABC Menu Engineering Analysis MENU ITEM QTY SOLD PF Cost % % 28 19 17 17 8 20 56 1 Pasta Marinara 2 Pasta Marinara Chicken 3 Pasta Marinara Shrimp 4 Pasta Marinara Vegetable 5 Pasta Marinara Shellfish 6 Mushroom Chicken Vio 7 Kavion Ravioli 8 Salmon valme 9 Shrimp and Scallop 10 Pork Osso Bucco 11 Mira Lago Paella 12 Chilean Sea Bass 13 Rib Eye Steak 14 Filet Mignon MENU ITEM ITEM ITEM TOTAL ITEM TOTAL ITEM TOTAL ITEM MIX % OP ABC PRICE (MM%) COST REVENUE OP PROFIT PROFIT 4.97% $ 18.12 $9.95 $ 8.17 S 507.36 $ 278.60 $ 228.76 3.37% $ 19.07 $ 13.95 $ 5.12 $ 362.33 $ 265.05 FS 97.28 3.02% $ 19.02 S 13.95 $ 5.07 S 323.34 $ 237.15 S 86.19 1.42% % $ 18.56 $ 11.95 $ 6.61 $ 148.48$ 95.60 $ 52.88 3.55% $ 19.31 $ 17.95 $ 1.36 $ 386.20 $ 359.00 FS 27.20 9.95% $ 18.34 S 12.95 $ 5.39 $ 1,027.04S 301.84 725.20 $ 1:22 125.20 301.04 $ 20.24 $ 13.95 $ 6.29 $ 364.32 $ 251.10 $ 113.22 8.70% $ 19.43 $ 16.95 $ 2.48$ 952.07 $ 830.55 FS 121.52 9.95% $ 23.16 $ 17.95 $ 5.21 $ 1,296.96 $ 1,005.20 $ 291.76 7.82% $ 23.36 $ 19.95 $ 3.41 $ 1,027.84 $ 877.80 FS 150.04 5.68% $ 19.43 $ 19.95 $ 0.52 $ 621.76 S 638.40 S 16.64 9.41% $ 20.59 $ 22.95 $ 2.36 $ 1,091.27 $ 1.216.35 IS 125.08 13.68% $ 22.85 $ 22.95 $ 0.10 $ 1,759.45 $ 1,767.15$ 7.70 15.28% $ 24.96 $ 29.95 $ 4.99 $ 29.95 $ 4.99 $ 2,146.56 $ 2,575.70 $ 429.14 $12,014.98 $11,122.85 MM % % CAT L L L L L H L H H H OP PROFIT CAT L 4 L L L H L 4 L L L L MENU ITEM CLASS DOG DOG DOG DOG PUZZLE PLOW FLOW DOG PLOW PLOW PLOW STAR STAR STAR STAR 18 49 56 44 3.20% 3.59 1.53 1.35 0.83 0.43 4.74 1.78 1.91 4.58 2.35 -0.26 -1.96 -0.12 -6.73 1.00 182.11% 136.70% 136.34% 155.31% 107.58% 141.62% 171.0270 145.0970 145.09% 114.63% % 17.00 129.03% 117.09% 97.39% 89.72% 99.56% 83.34% 108.02% H H H H 32 53 77 86 563 H H H H (5892.13) Average Menu Mix (%) Average Menu Item Operating Profit ($) Total Menu Food Cost (%) 5.00% ($1.58) 108.02% * point out differences to CM ME (mainly food cost vs ABC and CM vs Op Profit * need to reduce facility-sustaining allocation (could do so by increasing sales volume) + labor issues $ 3,749.08 $ 3,105.67 $ 990.67 $ 265.12 $ 230.35 $ 679.32 $ 9,020.21 $ 4,933.15 Example 2a Solution Revenue $ 115,232.65 Food Cost $ 51,870.29 Direct Operating Expenses $ 5,628.12 BOH Salaries $ 3,749.08 FOH Salaries $ 3,105.67 Overtime Pay $ 990.67 Utilities $ 883.09 Marketing $ 829.43 Employer Taxes $ 679.32 Insurance $ 412.27 Employer Insurance $ 265.12 Employee Meals $ 230.35 Landscaping $ 225.00 Depreciation, Equipment $ 95.89 Equipment Leases $ 70.56 Travel and Entertainment $ 67.09 Telephone $ 56.92 1.) Decompose the above GL exported information into labor and Labor Facility-Sustaining FOH $ 4,087.06 BOH $ 4,933.15 Total $ 9,020.21 $ 8,268.37 2.) Calculate cost pool rates (per min). Total hours worked FOH: 485 Total hours worked BOH: 815 FOH $ 0.14 /min BOH $ 0.10 /min Using the facility-sustaining cost pool, calculate an allocation value per menu item. 2,782 menu items were sold during the 3.) month. $ 8,268.37 -= $2.97 2782 1.16 $ Example 2b Bill of Activity - Grilled Chicken Burger Resource Required Cost Pool Rate Activity (minutes) ($ / min) Total Cost Unit-Level Activities FOH Communicating 0.30 Setting-Up 0.40 Serving Customers 0.25 Processing Checks 0.21 FOH Activity Center Total 0.14 $ 0.16 BOH Preparation 0.25 Cooking 0.60 Cleaning 0.15 BOH Activity Center Total 1.00 $ 0.10 $ 0.10 Unit Level Activity Pool Total $ 0.26 Batch-Level Activities FOH Setting-Up 0.35 Cleaning 0.5 Administrating 0.15 FOH Activity Center Total 1.00 $ 0.14 $ 0.14 BOH Preparation 0.85 Cleaning 0.20 BOH Activity Center Total 0.10 $ 0.11 Batch Level Activity Pool Total $ 0.25 Product-Sustaining Activities FOH Dining Room Supervision 0.20 FOH Activity Center Total 0.20 $ 0.14 $ 0.03 BOH Recipe Testing 0.50 Line Cook Training 0.60 BOH Activity Center Total 1.10 $ 0.10 $ 0.11 Product Sustaining Activity Pool Total $ 0.14 Cost per unit Facility Sustaining Activity Pool 1 unit $ 2.97 $ 2.97 Food Cost 1 unit $ 3.35 $ 3.35 Total Cost $ 6.97 1.05 $ ABC Menu Engineering Analysis MENU ITEM QTY SOLD PF Cost % % 28 19 17 17 8 20 56 1 Pasta Marinara 2 Pasta Marinara Chicken 3 Pasta Marinara Shrimp 4 Pasta Marinara Vegetable 5 Pasta Marinara Shellfish 6 Mushroom Chicken Vio 7 Kavion Ravioli 8 Salmon valme 9 Shrimp and Scallop 10 Pork Osso Bucco 11 Mira Lago Paella 12 Chilean Sea Bass 13 Rib Eye Steak 14 Filet Mignon MENU ITEM ITEM ITEM TOTAL ITEM TOTAL ITEM TOTAL ITEM MIX % OP ABC PRICE (MM%) COST REVENUE OP PROFIT PROFIT 4.97% $ 18.12 $9.95 $ 8.17 S 507.36 $ 278.60 $ 228.76 3.37% $ 19.07 $ 13.95 $ 5.12 $ 362.33 $ 265.05 FS 97.28 3.02% $ 19.02 S 13.95 $ 5.07 S 323.34 $ 237.15 S 86.19 1.42% % $ 18.56 $ 11.95 $ 6.61 $ 148.48$ 95.60 $ 52.88 3.55% $ 19.31 $ 17.95 $ 1.36 $ 386.20 $ 359.00 FS 27.20 9.95% $ 18.34 S 12.95 $ 5.39 $ 1,027.04S 301.84 725.20 $ 1:22 125.20 301.04 $ 20.24 $ 13.95 $ 6.29 $ 364.32 $ 251.10 $ 113.22 8.70% $ 19.43 $ 16.95 $ 2.48$ 952.07 $ 830.55 FS 121.52 9.95% $ 23.16 $ 17.95 $ 5.21 $ 1,296.96 $ 1,005.20 $ 291.76 7.82% $ 23.36 $ 19.95 $ 3.41 $ 1,027.84 $ 877.80 FS 150.04 5.68% $ 19.43 $ 19.95 $ 0.52 $ 621.76 S 638.40 S 16.64 9.41% $ 20.59 $ 22.95 $ 2.36 $ 1,091.27 $ 1.216.35 IS 125.08 13.68% $ 22.85 $ 22.95 $ 0.10 $ 1,759.45 $ 1,767.15$ 7.70 15.28% $ 24.96 $ 29.95 $ 4.99 $ 29.95 $ 4.99 $ 2,146.56 $ 2,575.70 $ 429.14 $12,014.98 $11,122.85 MM % % CAT L L L L L H L H H H OP PROFIT CAT L 4 L L L H L 4 L L L L MENU ITEM CLASS DOG DOG DOG DOG PUZZLE PLOW FLOW DOG PLOW PLOW PLOW STAR STAR STAR STAR 18 49 56 44 3.20% 3.59 1.53 1.35 0.83 0.43 4.74 1.78 1.91 4.58 2.35 -0.26 -1.96 -0.12 -6.73 1.00 182.11% 136.70% 136.34% 155.31% 107.58% 141.62% 171.0270 145.0970 145.09% 114.63% % 17.00 129.03% 117.09% 97.39% 89.72% 99.56% 83.34% 108.02% H H H H 32 53 77 86 563 H H H H (5892.13) Average Menu Mix (%) Average Menu Item Operating Profit ($) Total Menu Food Cost (%) 5.00% ($1.58) 108.02% * point out differences to CM ME (mainly food cost vs ABC and CM vs Op Profit * need to reduce facility-sustaining allocation (could do so by increasing sales volume) + labor issues
Step by Step Solution
There are 3 Steps involved in it

Get step-by-step solutions from verified subject matter experts