Question: With reference to table 2.1 and 2.2 above answer the following questions: i. What type of data is being sampled here? (1 mark) ii. What

With reference to table 2.1 and 2.2 above answer the following questions:

i. What type of data is being sampled here? (1 mark)

ii. What is the sample size? (1 mark)

iii. What is the value of ? (1 mark)

iv. Confirm by calculation the values for UCLR and LCLR and explain what these numbers mean. (4 marks)

v. Is this process in control? Explain? (1 marks)

vi. What additional steps could the quality assurance team take to identify the source of any problem? (2 marks)With reference to table 2.1 and 2.2 above answer

Table 2.1: 3 sigma control chart limit factors SAMPLE SIZE, n MEAN FACTOR, Az 1.880 UPPER RANGE, D4 3.268 LOWER RANGE, D3 2 0 3 1.023 2.574 0 4 .729 2.282 0 5 .577 2.115 0 6 .483 2.004 0 7 .419 1.924 0.076 8 .373 1.864 0.136 9 .337 1.816 0.184 10 .308 1.777 0.223 12 .266 1.716 0.284 Table 2.2: Statistical Process Control outputs UCL (Upper control limit) CL (Center line) LCL (Lower control limit) Sample Number Item1 Sample 1 12.2 Sample 2 11.9 Sample 3 12 Sample 4 12.5 Sample 5 12.2 Sample 6 12.1 Sample 7 12.3 Sample 8 12 Sample 9 12.1 Sample 10 12.6 Mean 12.6856 12.36 12.0344 Item2 Item3 12.6 12 12.5 12.4 12.2 12.9 12.5 12.4 12.8 12.7 12.5 11.8 12.4 12.8 12.1 12.4 12.8 12.4 12.4 12.1 Range 1.0193 0.67 0 Item4 12.1 12.7 13.1 12.8 12 12.3 12.4 12.2 11.9 12.3 Mean 12.225 12.375 12.55 12.55 12.425 12.175 12.475 12.175 12.3 12.35 Range 0.6 0.8 1.1 0.4 0.8 0.7 0.5 0.4 0.9 0.5

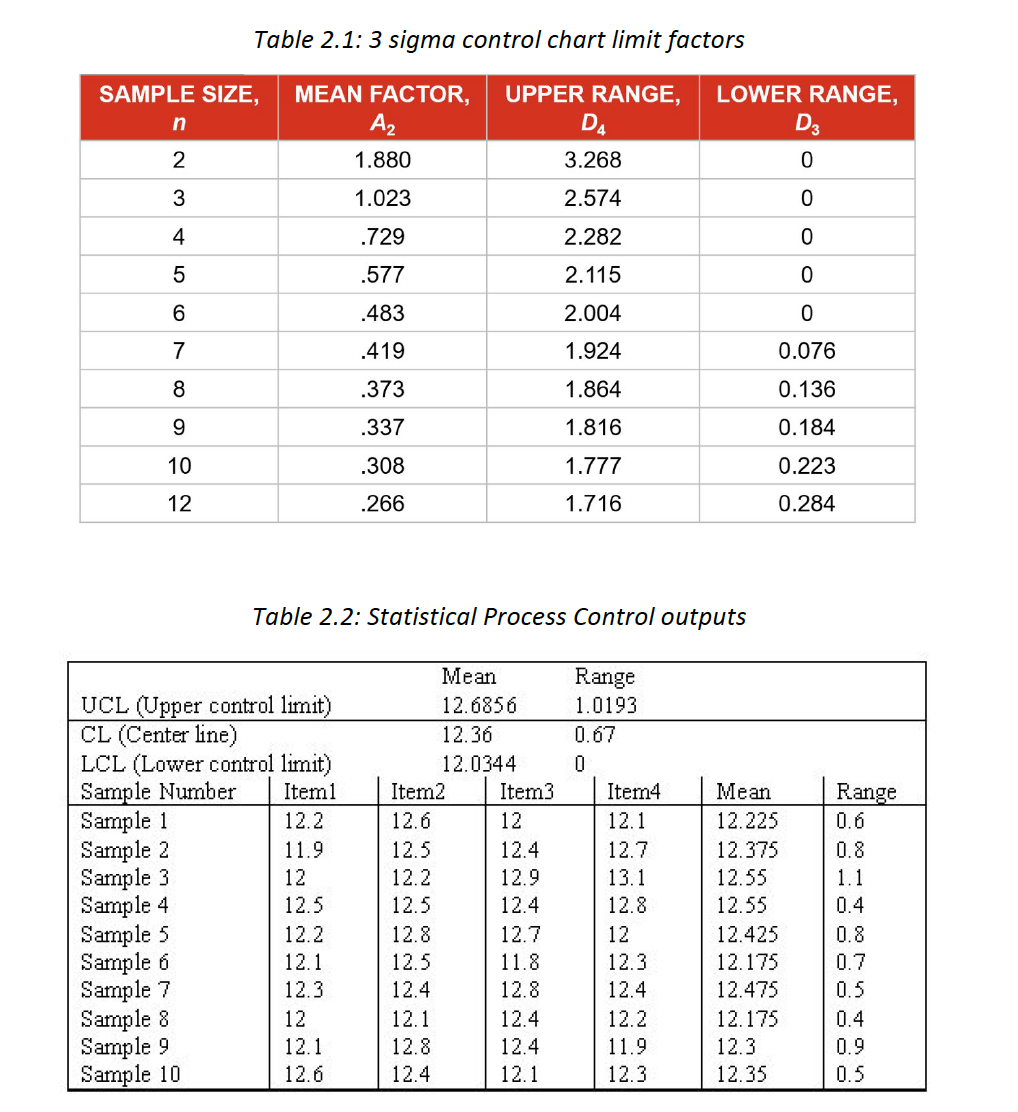
Step by Step Solution

There are 3 Steps involved in it

1 Expert Approved Answer
Step: 1 Unlock blur-text-image
Question Has Been Solved by an Expert!

Get step-by-step solutions from verified subject matter experts

Step: 2 Unlock
Step: 3 Unlock

Students Have Also Explored These Related General Management Questions!