

Question: With reference to the image below, answer the following questions. ( Estimated Response Time for Average Student: 1 minute ) 1 9 a . (
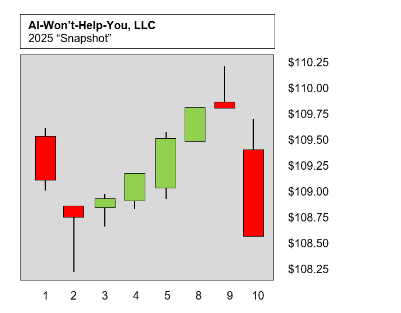
With reference to the image below, answer the following questions. Estimated Response Time for Average Student: minutea points What is the name for this type of graph? b points If someone had purchased shares in this company on Day at Closing Price and then sold their entire position on Day at the High of the Day, what would that persons net gain or loss beRound to the nearest dollarc points If someone had purchased shares in this company on Day at the High of the Day and then sold their entire position on Day at the Low of the Day, what would that persons net gain or loss beRound to the nearest dollard points What was the approximate range of trading price wise on Day e points Why do you suppose there is a nonsequential gap in trading days listed on the graphs xaxis
Step by Step Solution
There are 3 Steps involved in it
1 Expert Approved Answer
Step: 1 Unlock

Question Has Been Solved by an Expert!
Get step-by-step solutions from verified subject matter experts
Step: 2 Unlock
Step: 3 Unlock