

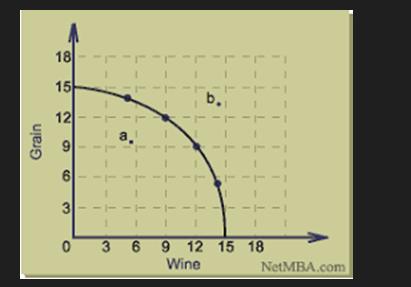
With reference to the Production Possibility diagram shown below: i. Are any points shown on the graph
Fantastic news! We've Found the answer you've been seeking!
Question:
With reference to the Production Possibility diagram shown below: i. Are any points shown on the graph efficient from a production point of view? ii. How would you assess whether any of the same points are efficient from an allocation point of view? iii. What is the cost if we increase wine production from 6 units to 9 units? iv. How can the economy reach wine and grain production given by point b?
Expert Answer:
1 i Yes point b is equally efficient from a production point of view in the graph ii To assess if the given points on the graph are efficient from an allocation point of view we will need to consider ... View the full answer

Related Book For 

Income Tax Fundamentals 2013
ISBN: 9781285586618
31st Edition
Authors: Gerald E. Whittenburg, Martha Altus Buller, Steven L Gill
Posted Date:
