

Question: With the below and attached data, can I get answers with solutions instead of suggestions? It would be very helpful to get a computation as
With the below and attached data, can I get answers with solutions instead of suggestions? It would be very helpful to get a computation as I am struggling.
Current Stock Price: $76.35
Current Annual Dividend Per Share: 1.20
Using the three financial statements, calculate the five-year historical average for Columbia's return on equity (ROE = net income/total stockholders' equity) and average dividend payout rate (Dividend paidet income).
6. To determine the stock value based on the dividend-discount model: a. Build a timeline in Excel for five years. b. Forecast the next five annual dividends based on the current dividend amount (from 2) and the five-year growth rate (from 4). c. Determine the long-term dividend growth rate using Eq. 9.12., and Columbia's retention rate (1- average payout rate) and expected return on new investments (use average ROE). d. Use the long-term growth rate to determine the stock price for year four using Eq. 9.13. e. Determine the current stock price using Eq. 9.14.
7. To determine the stock value based on the discounted free cash flow method: a. Forecast the free cash flows using the historic data from the financial statements to compute the five-year average of the following ratios: i. EBIT/Sales: Because Morningstar does not report EBIT, calculate EBIT from EBITDA (Income Statement) by subtracting Depreciation and Amortization (Statement of Cash Flow) ii. Net Property Plant and Equipment/Sales iii. Net Working Capital (excluding cash)/Sales b. Build a timeline for the next six years. c. Forecast future sales based on the most recent year's total revenue growing at the five-year growth rate (from 4) for the first five years. Use a long-run revenue growth rate of 3% for year six. d. Under the assumption that the ratios in part (a) remain constant, use the average ratios computed in part (a) to forecast EBIT (Sales * EBIT to Sales ratio), Net Investment (change in Sales * PPE to Sales ratio), and Increases in NWC (change in sales * NWC to Sales ratio) for the next six years. e. Forecast free cash flow for the next six years using Eq. 9.20 and the current corporate tax rate of 21%. f. Estimate the terminal enterprise value in year five using the free cash flow in year six and Eq. 9.24. g. Determine the enterprise value of the firm as the present value of the free cash flows. h. Determine the stock price using Eq. 9.22.
8. Compare the stock prices from the two methods to the actual stock price. What recommendations can you make as to whether clients should buy or sell Columbia stock based on your price estimates?
9. Explain to your boss why the estimates from the two valuation methods differ. Specifically, address the assumptions implicit in the models themselves as well as those you made in preparing your analysis. Why do these estimates differ from the actual stock price of Columbia?
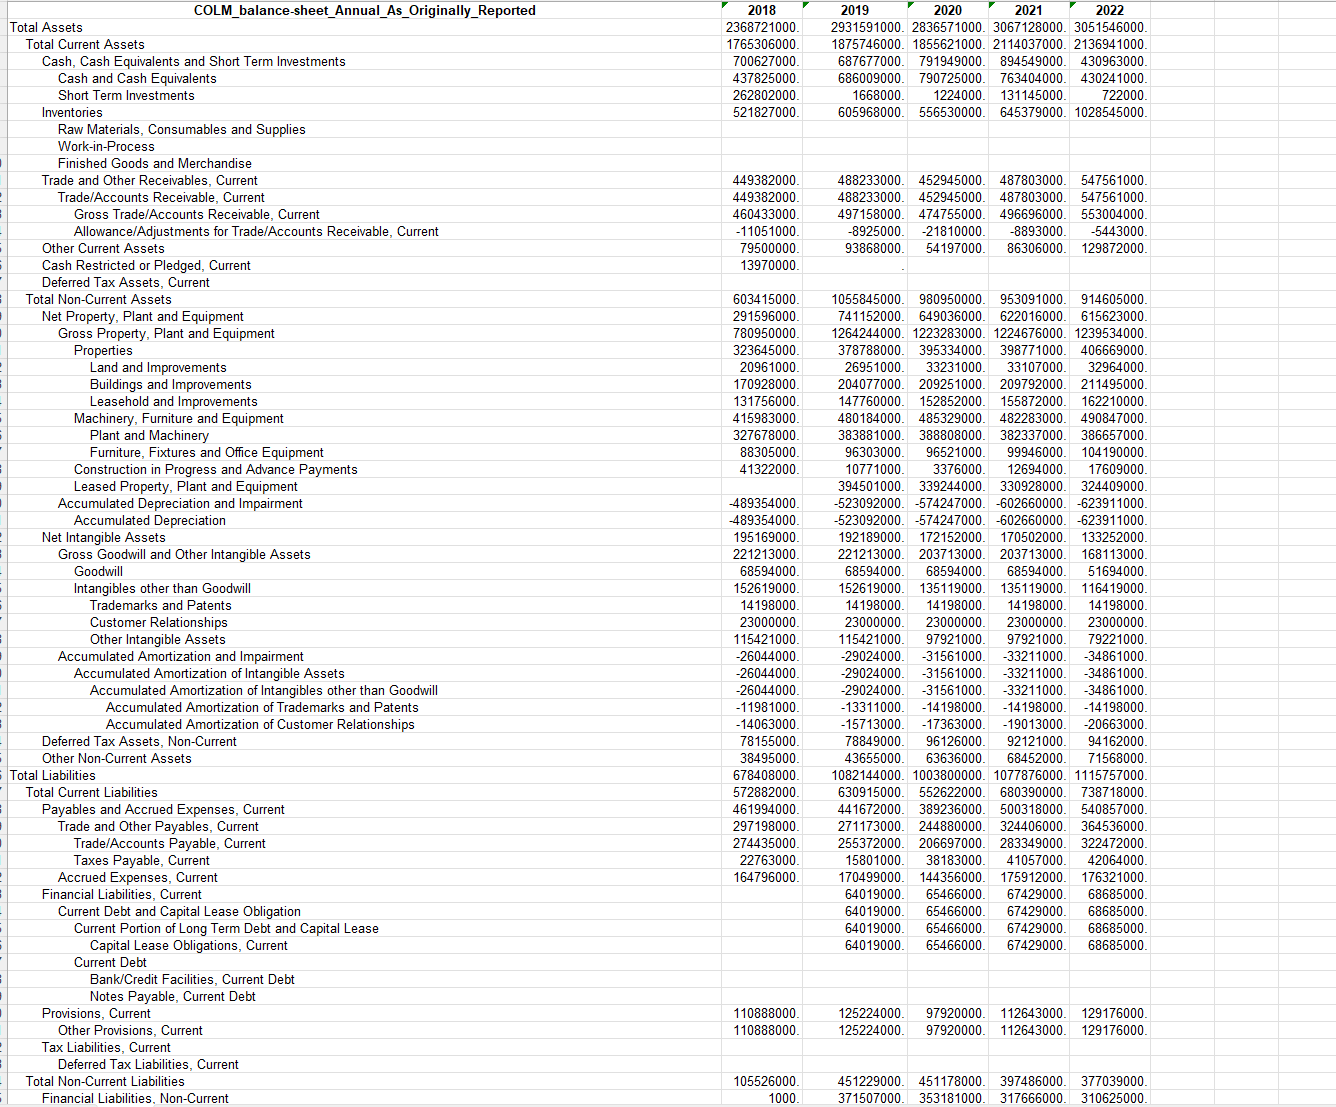
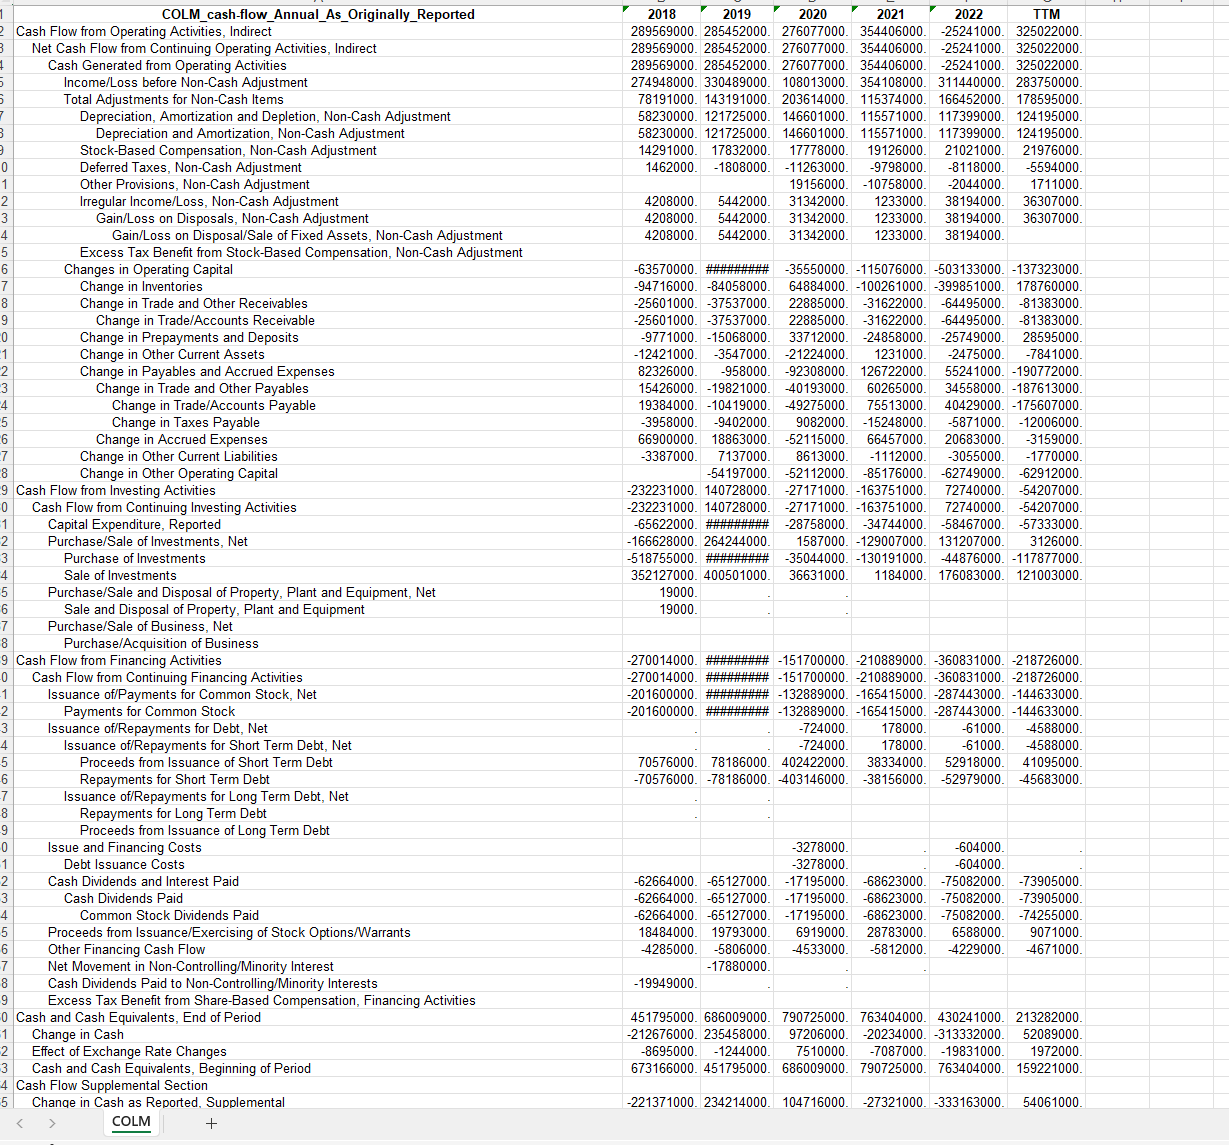
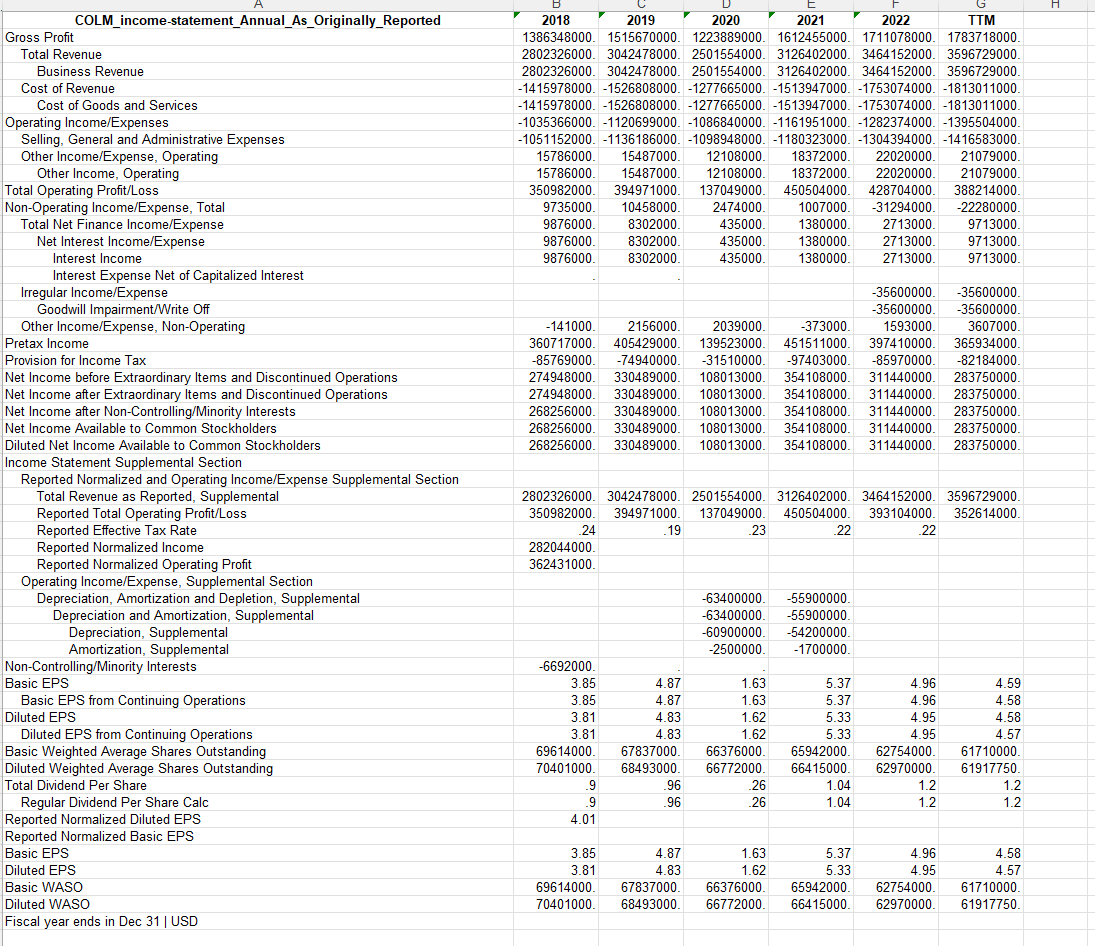
\begin{tabular}{|c|c|c|c|c|c|} \hline COLM balance-sheet Annual As Originally Reported & 2018 & 2019 & 2020 & 2021 & 2022 \\ \hline Total Assets & 2368721000 . & 2931591000 & 2836571000. & 3067128000 & 3051546000 \\ \hline Total Current Assets & 1765306000. & 1875746000 & 1855621000. & 2114037000. & 2136941000 \\ \hline Cash, Cash Equivalents and Short Term Investments & 700627000 . & 687677000 . & 791949000. & 894549000. & 430963000. \\ \hline Cash and Cash Equivalents & 437825000 . & 686009000. & 790725000 . & 763404000 . & 430241000 \\ \hline Short Term Investments & 262802000 . & 1668000 . & 1224000 . & 131145000 . & 722000 \\ \hline Inventories & 521827000 . & 605968000 . & 556530000 . & 645379000 . & 1028545000 \\ \hline \multicolumn{6}{|l|}{ Raw Materials, Consumables and Supplies } \\ \hline \multicolumn{6}{|l|}{ Work-in-Process } \\ \hline \multicolumn{6}{|l|}{ Finished Goods and Merchandise } \\ \hline Trade and Other Receivables, Current & 449382000 . & 488233000 . & 452945000 . & 487803000 . & 547561000 \\ \hline Trade/Accounts Receivable, Current & 449382000 & 488233000 . & 452945000 . & 487803000 . & 547561000 \\ \hline Gross Trade/Accounts Receivable, Current & 460433000 . & 497158000 & 474755000 . & 496696000 . & 553004000 \\ \hline Allowance/Adjustments for Trade/Accounts Receivable, Current & -11051000 & -8925000 & -21810000 & -8893000 & -5443000 \\ \hline Other Current Assets & 79500000 . & 93868000 . & 54197000 . & 86306000 . & 129872000 \\ \hline Cash Restricted or Pledged, Current & 13970000 . & & & & \\ \hline \multicolumn{6}{|l|}{ Deferred Tax Assets, Current } \\ \hline Total Non-Current Assets & 603415000 . & 1055845000 . & 980950000 . & 953091000 . & 914605000 \\ \hline Net Property, Plant and Equipment & 291596000 . & 741152000 & 649036000 . & 622016000 & 615623000 \\ \hline Gross Property, Plant and Equipment & 780950000 . & 1264244000 & 1223283000 . & 1224676000 . & 1239534000 \\ \hline Properties & 323645000 . & 378788000 & 395334000 . & 398771000 . & 406669000 \\ \hline Land and Improvements & 20961000 . & 26951000 . & 33231000 . & 33107000 . & 32964000 \\ \hline Buildings and Improvements & 170928000 . & 204077000 . & 209251000 . & 209792000 . & 211495000 \\ \hline Leasehold and Improvements & 131756000 . & 147760000 . & 152852000 . & 155872000 . & 162210000 \\ \hline Machinery, Furniture and Equipment & 415983000 . & 480184000 & 485329000 . & 482283000 . & 490847000 \\ \hline Plant and Machinery & 327678000 . & 383881000 . & 388808000 . & 382337000 . & 386657000 \\ \hline Furniture, Fixtures and Office Equipment & 88305000 . & 96303000 & 96521000 . & 99946000. & 104190000 \\ \hline Construction in Progress and Advance Payments & 41322000 . & 10771000 . & 3376000 . & 12694000 . & 17609000 \\ \hline Leased Property, Plant and Equipment & & 394501000 . & 339244000 . & 330928000 . & 324409000 \\ \hline Accumulated Depreciation and Impairment & -489354000 & -523092000 & -574247000 & -602660000 . & -623911000 \\ \hline Accumulated Depreciation & -489354000 & -523092000 & -574247000 & -602660000 . & -623911000 \\ \hline Net Intangible Assets & 195169000 & 192189000 & 172152000 & 170502000 . & 133252000 \\ \hline Gross Goodwill and Other Intangible Assets & 221213000 . & 221213000 . & 203713000 . & 203713000 & 168113000 \\ \hline Goodwill & 68594000 & 68594000 & 68594000 . & 68594000 . & 51694000 \\ \hline Intangibles other than Goodwill & 152619000 . & 152619000 . & 135119000. & 135119000. & 116419000 \\ \hline Trademarks and Patents & 14198000 & 14198000 & 14198000 & 14198000 & 14198000 \\ \hline Customer Relationships & 23000000 . & 23000000 . & 23000000 . & 23000000 . & 23000000 \\ \hline Other Intangible Assets & 115421000 . & 115421000. & 97921000. & 97921000. & 79221000 \\ \hline Accumulated Amortization and Impairment & -26044000 & -29024000 & -31561000 . & -33211000 & -34861000 \\ \hline Accumulated Amortization of Intangible Assets & -26044000 . & -29024000 . & -31561000 & -33211000 & -34861000 \\ \hline Accumulated Amortization of Intangibles other than Goodwill & -26044000 . & -29024000 . & -31561000 . & -33211000 & -34861000 \\ \hline Accumulated Amortization of Trademarks and Patents & -11981000 & -13311000 & -14198000 . & -14198000 & -14198000 \\ \hline Accumulated Amortization of Customer Relationships & -14063000 & -15713000 & -17363000 . & -19013000 & -20663000 \\ \hline Deferred Tax Assets, Non-Current & 78155000 . & 78849000 . & 96126000 . & 92121000 & 94162000 \\ \hline Other Non-Current Assets & 38495000 . & 43655000 . & 63636000 . & 68452000 & 71568000 \\ \hline Total Liabilities & 678408000 . & 1082144000 & 1003800000 & 1077876000 & 1115757000 \\ \hline Total Current Liabilities & 572882000 & 630915000 & 552622000 . & 680390000 & 738718000 \\ \hline Payables and Accrued Expenses, Current & 461994000 . & 441672000 . & 389236000 . & 500318000 & 540857000 \\ \hline Trade and Other Payables, Current & 297198000 . & 271173000 & 244880000 . & 324406000 . & 364536000 \\ \hline Trade/Accounts Payable, Current & 274435000 . & 255372000 . & 206697000 . & 283349000 . & 322472000 \\ \hline Taxes Payable, Current & 22763000 . & 15801000 & 38183000 . & 41057000 & 42064000 \\ \hline Accrued Expenses, Current & 164796000 . & 170499000. & 144356000 . & 175912000 & 176321000 \\ \hline Financial Liabilities, Current & & 64019000 . & 65466000 . & 67429000 & 68685000 \\ \hline Current Debt and Capital Lease Obligation & & 64019000 . & 65466000 . & 67429000 & 68685000 \\ \hline Current Portion of Long Term Debt and Capital Lease & & 64019000 . & 65466000 . & 67429000 . & 68685000 \\ \hline Capital Lease Obligations, Current & & 64019000 & 65466000 & 67429000 & 68685000 \\ \hline \multicolumn{6}{|l|}{ Current Debt } \\ \hline \multicolumn{6}{|l|}{ Bank/Credit Facilities, Current Debt } \\ \hline \multicolumn{6}{|l|}{ Notes Payable, Current Debt } \\ \hline Provisions, Current & 110888000 . & 125224000 . & 97920000 . & 112643000 . & 129176000 \\ \hline Other Provisions, Current & 110888000 & 125224000 . & 97920000 . & 112643000 . & 129176000 \\ \hline \multicolumn{6}{|l|}{ Tax Liabilities, Current } \\ \hline \multicolumn{6}{|l|}{ Deferred Tax Liabilities, Current } \\ \hline Total Non-Current Liabilities & 105526000 . & 451229000 . & 451178000 . & 397486000 . & 377039000 \\ \hline Financial Liabilities, Non-Current & 1000 . & 371507000 . & 353181000 . & 317666000 . & 310625000 \\ \hline \end{tabular} \begin{tabular}{|c|c|c|c|c|c|c|} \hline COLM_cash-flow_Annual_As_Originally_Reported & 2018 & 2019 & 2020 & 2021 & 2022 & TTM \\ \hline Cash Flow from Operating Activities, Indirect & 289569000. & 285452000 . & 276077000 . & 354406000 . & -25241000 . & 325022000 \\ \hline Net Cash Flow from Continuing Operating Activities, Indirect & 289569000 . & 285452000 . & 276077000 . & 354406000 . & -25241000 . & 325022000 \\ \hline Cash Generated from Operating Activities & 289569000. & 285452000 . & 276077000 . & 354406000 . & -25241000 . & 325022000 \\ \hline Income/Loss before Non-Cash Adjustment & 274948000 . & 330489000 . & 108013000 & 354108000 . & 311440000 . & 283750000 \\ \hline Total Adjustments for Non-Cash Items & 78191000 & 143191000 & 203614000 . & 115374000 & 166452000 . & 178595000 \\ \hline Depreciation, Amortization and Depletion, Non-Cash Adjustment & 58230000 . & 121725000 . & 146601000. & 115571000. & 117399000. & 124195000 \\ \hline Depreciation and Amortization, Non-Cash Adjustment & 58230000 & 121725000 . & 146601000 & 115571000 & 117399000 & 124195000 \\ \hline Stock-Based Compensation, Non-Cash Adjustment & 14291000. & 17832000 . & 17778000 . & 19126000. & 21021000 . & 21976000 \\ \hline Deferred Taxes, Non-Cash Adjustment & 1462000 & -1808000 . & -11263000 & -9798000 & -8118000 . & -5594000 \\ \hline Other Provisions, Non-Cash Adjustment & & & 19156000 & -10758000 & -2044000 & 1711000 \\ \hline Irregular Income/Loss, Non-Cash Adjustment & 4208000. & 5442000 . & 31342000 . & 1233000 . & 38194000 . & 36307000 \\ \hline Gain/Loss on Disposals, Non-Cash Adjustment & 4208000. & 5442000. & 31342000 . & 1233000. & 38194000 . & 36307000 \\ \hline Gain/Loss on Disposal/Sale of Fixed Assets, Non-Cash Adjustment & 4208000 & 5442000 . & 31342000 . & 1233000 . & 38194000 . & \\ \hline \multicolumn{7}{|l|}{ Excess Tax Benefit from Stock-Based Compensation, Non-Cash Adjustment } \\ \hline Changes in Operating Capital & -63570000 & \#\#\#\#\# & -35550000 . & -115076000 . & -503133000 . & -137323000 \\ \hline Change in Inventories & -94716000 & -84058000 & 64884000. & -100261000 . & -399851000 . & 178760000 \\ \hline Change in Trade and Other Receivables & -25601000 & -37537000 & 22885000 . & -31622000 & -64495000 & -81383000 \\ \hline Change in Trade/Accounts Receivable & -25601000 & -37537000 & 22885000 . & -31622000 & -64495000 & -81383000 \\ \hline Change in Prepayments and Deposits & -9771000 . & -15068000 & 33712000 . & -24858000 . & -25749000 . & 28595000 \\ \hline Change in Other Current Assets & -12421000 . & -3547000 . & -21224000 & 1231000. & -2475000 & -7841000 \\ \hline Change in Payables and Accrued Expenses & 82326000 & -958000 . & -92308000 . & 126722000. & 55241000. & -190772000 \\ \hline Change in Trade and Other Payables & 15426000 & -19821000 & -40193000 . & 60265000 . & 34558000 . & -187613000 \\ \hline Change in Trade/Accounts Payable & 19384000 & -10419000 & -49275000 & 75513000 . & 40429000 & -175607000 \\ \hline Change in Taxes Payable & -3958000 & -9402000 . & 9082000. & -15248000 . & -5871000 & -12006000 \\ \hline Change in Accrued Expenses & 66900000 . & 18863000 . & -52115000 & 66457000 . & 20683000. & -3159000 \\ \hline Change in Other Current Liabilities & -3387000 & 7137000 . & 8613000 . & -1112000 & -3055000 . & -1770000 \\ \hline Change in Other Operating Capital & & -54197000 & -52112000 & -85176000 & -62749000 & -62912000 \\ \hline Cash Flow from Investing Activities & -232231000 & 140728000 . & -27171000 & -163751000 & 72740000 & -54207000 \\ \hline Cash Flow from Continuing Investing Activities & -232231000 & 140728000 & -27171000 & -163751000 & 72740000 & -54207000 \\ \hline Capital Expenditure, Reported & -65622000 & \#\#\#\#\# & -28758000 & -34744000 & -58467000 . & -57333000 \\ \hline Purchase/Sale of Investments, Net & -166628000 & 264244000 & 1587000 & -129007000 . & 131207000 & 3126000 \\ \hline Purchase of Investments & -518755000 & \#\#\#\#\# & -35044000 & -130191000 . & -44876000 & -117877000 \\ \hline Sale of Investments & 352127000 . & 400501000 & 36631000 . & 1184000. & 176083000 & 121003000 \\ \hline Purchase/Sale and Disposal of Property, Plant and Equipment, Net & 19000. & & & & & \\ \hline Sale and Disposal of Property, Plant and Equipment & 19000. & & & & & \\ \hline \multicolumn{7}{|l|}{ Purchase/Sale of Business, Net } \\ \hline \multicolumn{7}{|l|}{ Purchase/Acquisition of Business } \\ \hline Cash Flow from Financing Activities & -270014000 & \#\#\#\#\# & -151700000 . & -210889000 . & -360831000 . & -218726000 \\ \hline Cash Flow from Continuing Financing Activities & -270014000 & \#\# & -151700000 . & -210889000 & -360831000 & -218726000 \\ \hline Issuance of/Payments for Common Stock, Net & -201600000 & \#\#\#\#\# & -132889000 . & -165415000 . & -287443000 . & -144633000 \\ \hline Payments for Common Stock & -201600000 & \#\#\#\#\#\# & -132889000 . & -165415000 & -287443000 . & -144633000 \\ \hline Issuance of/Repayments for Debt, Net & & & -724000 & 178000. & -61000 . & -4588000 \\ \hline Issuance of/Repayments for Short Term Debt, Net & & & -724000 . & 178000. & -61000 . & -4588000 \\ \hline Proceeds from Issuance of Short Term Debt & 70576000 & 78186000 . & 402422000 . & 38334000 . & 52918000 . & 41095000 \\ \hline Repayments for Short Term Debt & -70576000 & -78186000 & -403146000 . & -38156000 & -52979000 . & -45683000 \\ \hline \multirow{2}{*}{\multicolumn{7}{|c|}{\begin{tabular}{l} Issuance of/Repayments for Long Term Debt, Net \\ Repayments for Long Term Debt \end{tabular}}} \\ \hline \multirow{2}{*}{\multicolumn{7}{|c|}{\begin{tabular}{l} Repayments for Long Term Debt \\ Proceeds from Issuance of Long Term Debt \end{tabular}}} \\ \hline & & & & & & \\ \hline Issue and Financing Costs & & & -3278000 . & & -604000 . & \\ \hline Debt Issuance Costs & & & -3278000 . & & -604000 . & \\ \hline Cash Dividends and Interest Paid & -62664000 & -65127000 & -17195000 & -68623000 . & -75082000 & -73905000 \\ \hline Cash Dividends Paid & -62664000 & -65127000 & -17195000 . & -68623000 & -75082000 & -73905000 \\ \hline Common Stock Dividends Paid & -62664000 & -65127000 & -17195000 . & -68623000 . & -75082000 . & -74255000 \\ \hline Proceeds from Issuance/Exercising of Stock Options/Warrants & 18484000. & 19793000. & 6919000. & 28783000 . & 6588000. & 9071000 \\ \hline Other Financing Cash Flow & -4285000 & -5806000 . & -4533000 . & -5812000 & -4229000 . & -4671000 \\ \hline Net Movement in Non-Controlling/Minority Interest & & -17880000 & & & & \\ \hline Cash Dividends Paid to Non-Controlling/Minority Interests & -19949000 & & & & & \\ \hline \multicolumn{7}{|l|}{ Excess Tax Benefit from Share-Based Compensation, Financing Activities } \\ \hline Cash and Cash Equivalents, End of Period & 451795000 & 686009000 . & 790725000 . & 763404000 . & 430241000 . & 213282000 \\ \hline Change in Cash & -212676000 & 235458000 & 97206000 . & -20234000 & -313332000 . & 52089000 \\ \hline Effect of Exchange Rate Changes & -8695000 & -1244000 & 7510000 & -7087000 & -19831000 & 1972000 \\ \hline Cash and Cash Equivalents, Beginning of Period & 673166000 & 451795000 & 686009000. & 790725000 & 763404000 & 159221000 \\ \hline Cash Flow Supplemental Section & & & & & & \\ \hline Chanqe in Cash as Reported, Supplemental & -221371000 & 234214000 . & 104716000 . & -27321000 & -333163000 . & 54061000 \\ \hline \end{tabular} \begin{tabular}{|c|c|c|c|c|c|c|} \hline \\ \hline Cash Flow from Financing Activities & -270014000 & \#\#\#\# & -151700000 & -210889000 & -360831000 & -218726000 \\ \hline Cash Flow from Continuing Financing Activities & -270014000 & \#\#\#\#\# & -151700000 & -210889000 & -360831000 . & -218726000 \\ \hline Issuance of/Payments for Common Stock, Net & -201600000 & \#\#\#\#\# & -132889000 & -165415000 & -287443000 . & -144633000 \\ \hline Payments for Common Stock & -201600000 & \#\#\#\#\# & -132889000 & -165415000 & -287443000 & -144633000 \\ \hline Issuance of/Repayments for Debt, Net & & & -724000 & 178000 & -61000 & -4588000 \\ \hline Issuance of/Repayments for Short Term Debt, Net & & & -724000 . & 178000 & -61000 & -4588000 \\ \hline Proceeds from Issuance of Short Term Debt & 70576000 & 78186000 . & 402422000 . & 38334000 . & 52918000 . & 41095000 \\ \hline Repayments for Short Term Debt & -70576000 & -78186000 & -403146000 & -38156000 & -52979000 & -45683000 \\ \hline \multicolumn{7}{|l|}{ Issuance of/Repayments for Long Term Debt, Net } \\ \hline \multicolumn{7}{|l|}{ Repayments for Long Term Debt } \\ \hline \multicolumn{7}{|l|}{ Proceeds from Issuance of Long Term Debt } \\ \hline Issue and Financing Costs & & & -3278000 & & -604000 & \\ \hline Debt Issuance Costs & & & -3278000 & & -604000 & \\ \hline Cash Dividends and Interest Paid & -62664000 & -65127000 & -17195000 & -68623000 & -75082000 . & -73905000 \\ \hline Cash Dividends Paid & -62664000 & -65127000 . & -17195000 & -68623000 & -75082000 . & -73905000 \\ \hline Common Stock Dividends Paid & -62664000 & -65127000 & -17195000 . & -68623000 . & -75082000 & -74255000 \\ \hline Proceeds from Issuance/Exercising of Stock Options/Warrants & 18484000 & 19793000 & 6919000. & 28783000 . & 6588000 . & 9071000 \\ \hline Other Financing Cash Flow & -4285000 & -5806000 & -4533000 & -5812000 & -4229000 & -4671000 \\ \hline Net Movement in Non-Controlling/Minority Interest & & -17880000 & & & & \\ \hline Cash Dividends Paid to Non-Controlling/Minority Interests & -19949000 & & & & & \\ \hline \multicolumn{7}{|l|}{ Excess Tax Benefit from Share-Based Compensation, Financing Activities } \\ \hline Cash and Cash Equivalents, End of Period & 451795000 . & 686009000 . & 790725000 . & 763404000 . & 430241000 . & 213282000 \\ \hline Change in Cash & -212676000 & 235458000 . & 97206000 . & -20234000 & -313332000 . & 52089000 \\ \hline Effect of Exchange Rate Changes & -8695000 & -1244000 & 7510000 & -7087000 & -19831000 & 1972000 \\ \hline Cash and Cash Equivalents, Beginning of Period & 673166000 & 451795000 . & 686009000 . & 790725000 . & 763404000 & 159221000 \\ \hline \multicolumn{7}{|l|}{ Cash Flow Supplemental Section } \\ \hline Change in Cash as Reported, Supplemental & -221371000 & 234214000 . & 104716000. & -27321000 & -333163000 . & 54061000 \\ \hline Income Tax Paid, Supplemental & -77408000 & -99062000 . & -14687000 & -129483000 & -92110000 & -99106000 \\ \hline \multicolumn{7}{|l|}{ Interest Paid, Supplemental } \\ \hline \multicolumn{7}{|l|}{ Fiscal year ends in Dec 31 | USD } \\ \hline & & & & & & \\ \hline & & & & & & \\ \hline & & & & & & \\ \hline \end{tabular} \begin{tabular}{|c|c|c|c|c|c|c|} \hline COLM_income-statement_Annual_As_Originally_Reported & 2018 & 2019 & 2020 & 2021 & 2022 & TTM \\ \hline Gross Profit & 1386348000 . & 1515670000 . & 1223889000 & 1612455000 . & 1711078000 . & 1783718000 . \\ \hline Total Revenue & 2802326000 . & 3042478000 . & 2501554000 & 3126402000 . & 3464152000 . & 3596729000 . \\ \hline Business Revenue & 2802326000 . & 3042478000 . & 2501554000 & 3126402000 . & 3464152000 . & 3596729000 . \\ \hline Cost of Revenue & -1415978000 & -1526808000 & -1277665000 & -1513947000 & -1753074000 & -1813011000 \\ \hline Cost of Goods and Services & -1415978000 & -1526808000 & -1277665000 & -1513947000 & -1753074000 & -1813011000 \\ \hline Operating Income/Expenses & -1035366000 & -1120699000 & -1086840000 & -1161951000 & -1282374000 & -1395504000 \\ \hline Selling, General and Administrative Expenses & -1051152000 & -1136186000 & -1098948000 & -1180323000 & -1304394000 . & -1416583000 \\ \hline Other Income/Expense, Operating & 15786000 & 15487000 & 12108000 & 18372000. & 22020000 . & 21079000. \\ \hline Other Income, Operating & 15786000 & 15487000 & 12108000 & 18372000. & 22020000 . & 21079000 . \\ \hline Total Operating Profit/Loss & 350982000 . & 394971000 . & 137049000 . & 450504000 . & 428704000 . & 388214000 . \\ \hline Non-Operating Income/Expense, Total & 9735000 & 10458000 . & 2474000 & 1007000 & -31294000 & -22280000 . \\ \hline Total Net Finance Income/Expense & 9876000. & 8302000. & 435000 & 1380000 & 2713000 & 9713000. \\ \hline Net Interest Income/Expense & 9876000. & 8302000 . & 435000 . & 1380000 & 2713000 . & 9713000 . \\ \hline Interest Income & 9876000 . & 8302000 . & 435000 & 1380000 . & 2713000 . & 9713000 . \\ \hline \multicolumn{7}{|l|}{ Interest Expense Net of Capitalized Interest } \\ \hline Irregular Income/Expense & & & & & -35600000 & -35600000 . \\ \hline Goodwill Impairment/Write Off & & & & & -35600000 & -35600000 \\ \hline Other Income/Expense, Non-Operating & -141000 & 2156000 . & 2039000. & -373000 & 1593000. & 3607000 . \\ \hline Pretax Income & 360717000 . & 405429000 . & 139523000 . & 451511000. & 397410000 . & 365934000. \\ \hline Provision for Income Tax & -85769000 & -74940000 & -31510000 & -97403000 . & -85970000 . & -82184000 . \\ \hline Net Income before Extraordinary Items and Discontinued Operations & 274948000 . & 330489000 . & 108013000 . & 354108000 . & 311440000 . & 283750000 . \\ \hline Net Income after Extraordinary Items and Discontinued Operations & 274948000 . & 330489000 . & 108013000 . & 354108000 . & 311440000 . & 283750000 . \\ \hline Net Income after Non-Controlling/Minority Interests & 268256000 . & 330489000 . & 108013000 . & 354108000 . & 311440000 . & 283750000 . \\ \hline Net Income Available to Common Stockholders & 268256000 . & 330489000 . & 108013000 . & 354108000 . & 311440000 . & 283750000 . \\ \hline Diluted Net Income Available to Common Stockholders & 268256000 . & 330489000 . & 108013000 . & 354108000 . & 311440000 . & 283750000 . \\ \hline \multicolumn{7}{|l|}{ Income Statement Supplemental Section } \\ \hline \multicolumn{7}{|l|}{ Reported Normalized and Operating Income/Expense Supplemental Section } \\ \hline Total Revenue as Reported, Supplemental & 2802326000 . & 3042478000 . & 2501554000 & 3126402000 . & 3464152000 . & 3596729000 . \\ \hline Reported Total Operating Profit/Loss & 350982000 . & 394971000 . & 137049000 . & 450504000 . & 393104000 . & 352614000 . \\ \hline Reported Effective Tax Rate & .24 & .19 & .23 & .22 & .22 & \\ \hline Reported Normalized Income & 282044000 . & & & & & \\ \hline Reported Normalized Operating Profit & 362431000 . & & & & & \\ \hline \multicolumn{7}{|l|}{ Operating Income/Expense, Supplemental Section } \\ \hline Depreciation, Amortization and Depletion, Supplemental & & & -63400000 & -55900000 & & \\ \hline Depreciation and Amortization, Supplemental & & & -63400000 & -55900000 & & \\ \hline Depreciation, Supplemental & & & -60900000 & -54200000 & & \\ \hline Amortization, Supplemental & & & -2500000 & -1700000 . & & \\ \hline Non-Controlling/Minority Interests & -6692000 & & & & & \\ \hline Basic EPS & 3.85 & 4.87 & 1.63 & 5.37 & 4.96 & 4.59 \\ \hline Basic EPS from Continuing Operations & 3.85 & 4.87 & 1.63 & 5.37 & 4.96 & 4.58 \\ \hline Diluted EPS & 3.81 & 4.83 & 1.62 & 5.33 & 4.95 & 4.58 \\ \hline Diluted EPS from Continuing Operations & 3.81 & 4.83 & 1.62 & 5.33 & 4.95 & 4.57 \\ \hline Basic Weighted Average Shares Outstanding & 69614000 . & 67837000 . & 66376000 . & 65942000 . & 62754000 . & 61710000 \\ \hline Diluted Weighted Average Shares Outstanding & 70401000 & 68493000. & 66772000 . & 66415000. & 62970000. & 61917750. \\ \hline Total Dividend Per Share & 9 & 96 & .26 & 1.04 & 1.2 & 1.2 \\ \hline Regular Dividend Per Share Calc & 9 & 96 & .26 & 1.04 & 1.2 & 1.2 \\ \hline Reported Normalized Diluted EPS & 4.01 & & & & & \\ \hline \multicolumn{7}{|l|}{ Reported Normalized Basic EPS } \\ \hline Basic EPS & 3.85 & 4.87 & 1.63 & 5.37 & 4.96 & 4.58 \\ \hline Diluted EPS & 3.81 & 4.83 & 1.62 & 5.33 & 4.95 & 4.57 \\ \hline Basic WASO & 69614000. & 67837000. & 66376000. & 65942000. & 62754000 . & 61710000. \\ \hline Diluted WASO & 70401000 . & 68493000. & 66772000. & 66415000 . & 62970000 . & 61917750. \\ \hline \end{tabular} USD | As of Nov 12, 2023 | Index: Morningstar US Market TR USD
Step by Step Solution
There are 3 Steps involved in it

Get step-by-step solutions from verified subject matter experts