

Question: with the data provided can you do an analysis of the industry based on my calculation. using the data descrive its size, trends and average,
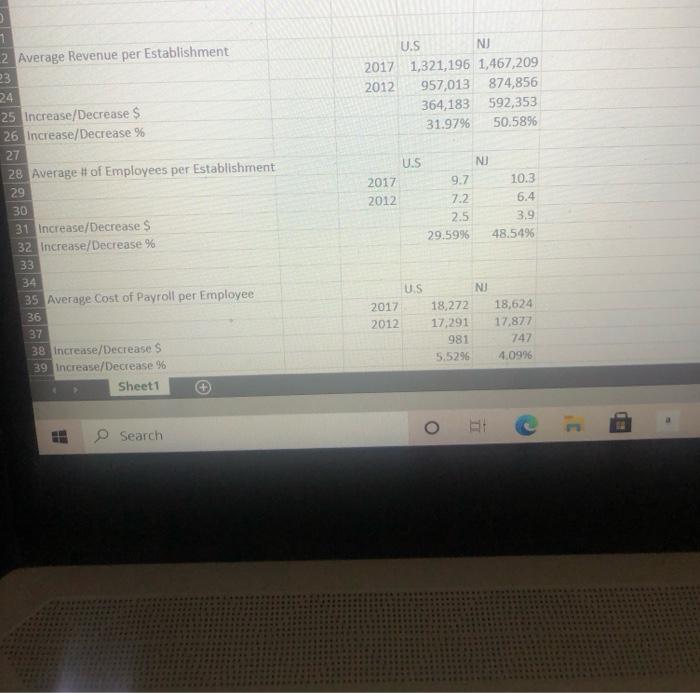
1 intry Animatiomem Ya Share 1472 LI TO tyd 2001 2011 DE SOL Der ET 1 -2 Average Revenue per Establishment 23 24 25 Increase/Decrease $ 26 Increase/Decrease % 27 28 Average of Employees per Establishment U.S NU 2017 1,321,196 1,467,209 2012 957,013 874,856 364,183 592,353 31.97% 50.5896 NU U.S 2017 2012 9.7 10.3 29 7.2 2.5 6.4 3.9 48.5496 29.5996 30 31 Increase/Decrease $ 32 Increase/Decrease % 33 34 39 Average Cost of Payroll per Employee 36 NU US 2017 2012 37 18,272 17,291 981 5.5296 18,624 17,877 747 4.0996 38 Increase/Decrease $ 39 Increase/Decrease % Sheet1 Search 1 intry Animatiomem Ya Share 1472 LI TO tyd 2001 2011 DE SOL Der ET 1 -2 Average Revenue per Establishment 23 24 25 Increase/Decrease $ 26 Increase/Decrease % 27 28 Average of Employees per Establishment U.S NU 2017 1,321,196 1,467,209 2012 957,013 874,856 364,183 592,353 31.97% 50.5896 NU U.S 2017 2012 9.7 10.3 29 7.2 2.5 6.4 3.9 48.5496 29.5996 30 31 Increase/Decrease $ 32 Increase/Decrease % 33 34 39 Average Cost of Payroll per Employee 36 NU US 2017 2012 37 18,272 17,291 981 5.5296 18,624 17,877 747 4.0996 38 Increase/Decrease $ 39 Increase/Decrease % Sheet1 Search
Step by Step Solution
There are 3 Steps involved in it

Get step-by-step solutions from verified subject matter experts