

Question: With the following. code now code each of the following separate cells in python: 1. Store the x and y locations in a new data
With the following. code now code each of the following separate cells in python:
1. Store the x and y locations in a new data frame.
2. Create a scatterplot using seaborn.
3. Set up the pyomo model
4. Create the Decision Variables and the Objective Function.
5. Solve the model
6. Output the optimal objective value, the optimal x location, and the optimal y location.
7. Redo the scatterplot and add the optimal solution as a point in red.
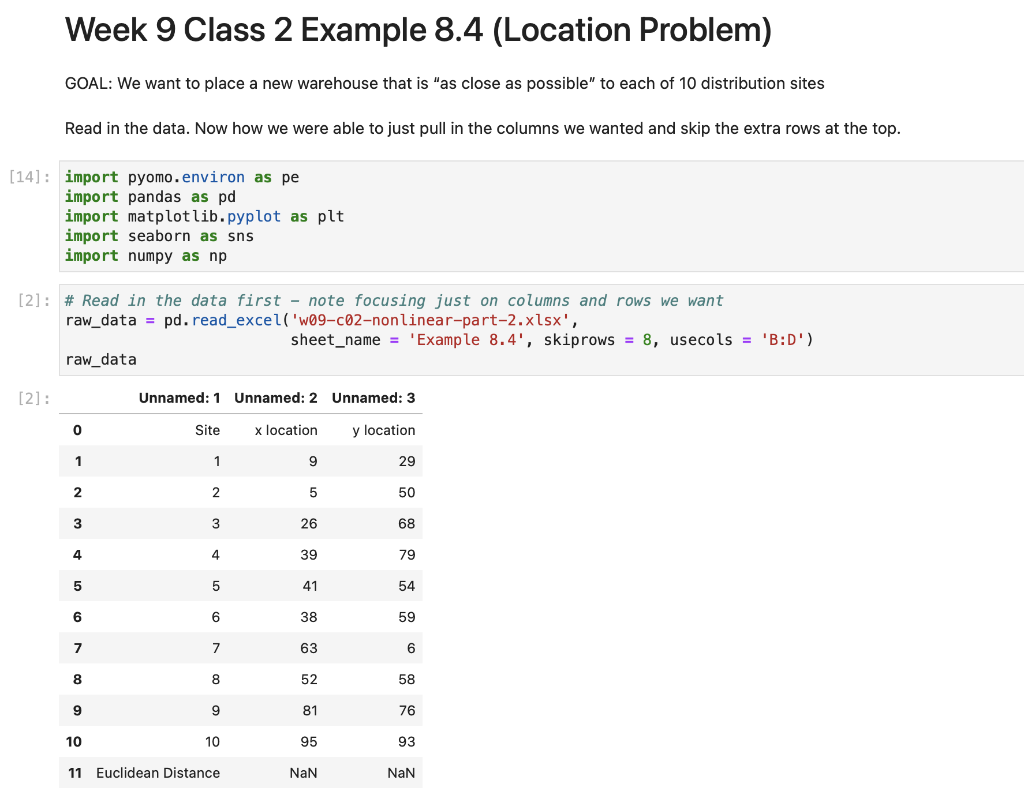
Week 9 Class 2 Example 8.4 (Location Problem) GOAL: We want to place a new warehouse that is "as close as possible" to each of 10 distribution sites Read in the data. Now how we were able to just pull in the columns we wanted and skip the extra rows at the top. [2]: \# Read in the data first - note focusing just on columns and rows we want raw_data = pd. read_excel ( 'w09-c02-nonlinear-part-2.xlsx', sheet_name = 'Example 8.4, skiprows =8, usecols =B:D ') raw_data [2] : Unnamed: 1 Unnamed: 2 Unnamed: 3 \begin{tabular}{rrrr} \hline 0 & Site & x location & y location \\ 1 & 1 & 9 & 29 \\ 2 & 2 & 5 & 50 \\ 3 & 3 & 26 & 68 \\ 4 & 4 & 39 & 79 \\ 5 & 5 & 41 & 54 \\ 7 & 6 & 38 & 59 \\ 8 & 7 & 63 & 6 \\ 9 & 8 & 52 & 58 \\ 10 & 9 & 81 & 76 \\ 11 & Euclidean Distance & NaN & NaN \end{tabular}
Step by Step Solution
There are 3 Steps involved in it

Get step-by-step solutions from verified subject matter experts