

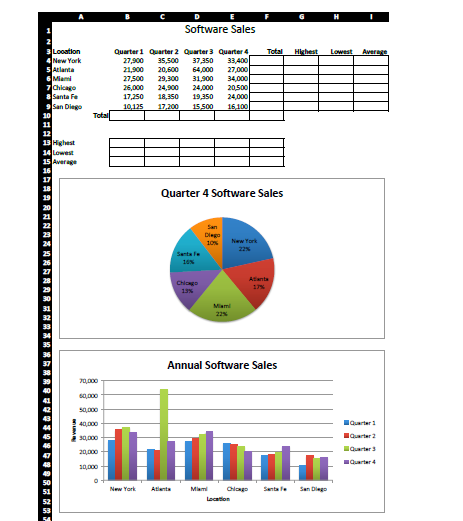
Question: With The following example, re-create these exact chart in Excel. Software Sales Quarter 1 Quarter 2 Quarter 3 Quarter 4TotalHighestLowestAverege 27,900 35,500 37350 33,400 21,900
With The following example, re-create these exact chart in Excel.
Software Sales Quarter 1 Quarter 2 Quarter 3 Quarter 4TotalHighestLowestAverege 27,900 35,500 37350 33,400 21,900 20,600 64,000 27,000 27,500 29,300 31,900 34,000 26,000 24,900 24,000 20,500 17250 18,350 19,350 24,000 New York Highest Quarter 4 Software Sales 10% Naw Y Annual Software Sales 0.000 Quarter
Step by Step Solution
There are 3 Steps involved in it
1 Expert Approved Answer
Step: 1 Unlock

Question Has Been Solved by an Expert!
Get step-by-step solutions from verified subject matter experts
Step: 2 Unlock
Step: 3 Unlock