

Question: with the given data compute eaxh budgeting process. compute the following chart: begin{tabular}{|rrr|} hline Units sold & 105000 & 102000 hline Sales $ &
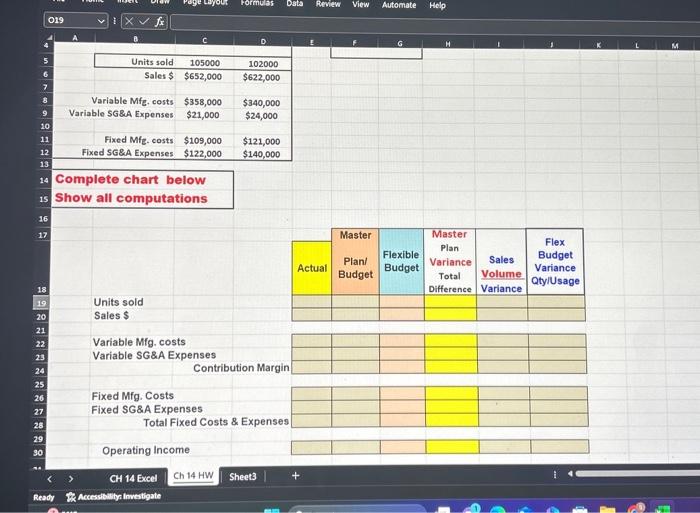
\begin{tabular}{|rrr|} \hline Units sold & 105000 & 102000 \\ \hline Sales $ & $652,000 & $622,000 \\ \hline Variable Mfe-costs & $358,000 & $340,000 \\ \hline Fixed Mfe-costs & $109,000 & $121,000 \\ \hline Fed SG\&A Expenses & $122,000 & $140,000 \\ \hline \end{tabular} Complete chart below Show all computations Units sold Sales \$ \begin{tabular}{|c|c|c|c|c|c|} \hline & \multirow[b]{2}{*}{\begin{tabular}{c} Master \\ Plan/ \\ Budget \end{tabular}} & \multirow[b]{2}{*}{\begin{tabular}{l} Flexible \\ Budget \end{tabular}} & \multirow[b]{2}{*}{\begin{tabular}{c} Master \\ Plan \\ Variance \\ Total \\ Difference \end{tabular}} & \multirow[b]{2}{*}{\begin{tabular}{c} Sales \\ Volume \\ Variance \end{tabular}} & \multirow[b]{2}{*}{\begin{tabular}{c} Flex \\ Budget \\ Variance \\ QtylUsage \end{tabular}} \\ \hline Actual & & & & & \\ \hline & & & & & \\ \hline & & & & & \\ \hline \end{tabular} Variable Mfg. costs Variable SG\&A Expenses Contribution Margin \begin{tabular}{|l|l|l|l|l|l|} \hline & & & & & \\ \hline & & & & & \\ \hline & & & & & \\ \hline \end{tabular} Fixed Mfg. Costs Fixed SG\&A Expenses Total Fixed Costs \& Expenses \begin{tabular}{|l|l|l|l|l|l|} \hline & & & & & \\ \hline & & & & & \\ \hline & & & & & \\ \hline \end{tabular} Operating Income CH 14 Excel Ch 14HW Sheet3 \begin{tabular}{|rrr|} \hline Units sold & 105000 & 102000 \\ \hline Sales $ & $652,000 & $622,000 \\ \hline Variable Mfe-costs & $358,000 & $340,000 \\ \hline Fixed Mfe-costs & $109,000 & $121,000 \\ \hline Fed SG\&A Expenses & $122,000 & $140,000 \\ \hline \end{tabular} Complete chart below Show all computations Units sold Sales \$ \begin{tabular}{|c|c|c|c|c|c|} \hline & \multirow[b]{2}{*}{\begin{tabular}{c} Master \\ Plan/ \\ Budget \end{tabular}} & \multirow[b]{2}{*}{\begin{tabular}{l} Flexible \\ Budget \end{tabular}} & \multirow[b]{2}{*}{\begin{tabular}{c} Master \\ Plan \\ Variance \\ Total \\ Difference \end{tabular}} & \multirow[b]{2}{*}{\begin{tabular}{c} Sales \\ Volume \\ Variance \end{tabular}} & \multirow[b]{2}{*}{\begin{tabular}{c} Flex \\ Budget \\ Variance \\ QtylUsage \end{tabular}} \\ \hline Actual & & & & & \\ \hline & & & & & \\ \hline & & & & & \\ \hline \end{tabular} Variable Mfg. costs Variable SG\&A Expenses Contribution Margin \begin{tabular}{|l|l|l|l|l|l|} \hline & & & & & \\ \hline & & & & & \\ \hline & & & & & \\ \hline \end{tabular} Fixed Mfg. Costs Fixed SG\&A Expenses Total Fixed Costs \& Expenses \begin{tabular}{|l|l|l|l|l|l|} \hline & & & & & \\ \hline & & & & & \\ \hline & & & & & \\ \hline \end{tabular} Operating Income CH 14 Excel Ch 14HW Sheet3
Step by Step Solution
There are 3 Steps involved in it

Get step-by-step solutions from verified subject matter experts