

Question: With the information in the attachments please help with the following: Brief summary of the article, including the source Link for article:https://www.usnews.com/higher-education/online-education/articles/2017-04-04/us-news-data-the-average-online-bachelors-student Description of population,
With the information in the attachments please help with the following:
- Brief summary of the article, including the source
- Link for article:https://www.usnews.com/higher-education/online-education/articles/2017-04-04/us-news-data-the-average-online-bachelors-student
- Description of population, sample, and statistic for the study involving our class
- Statement of the claims in the article that were tested in this project
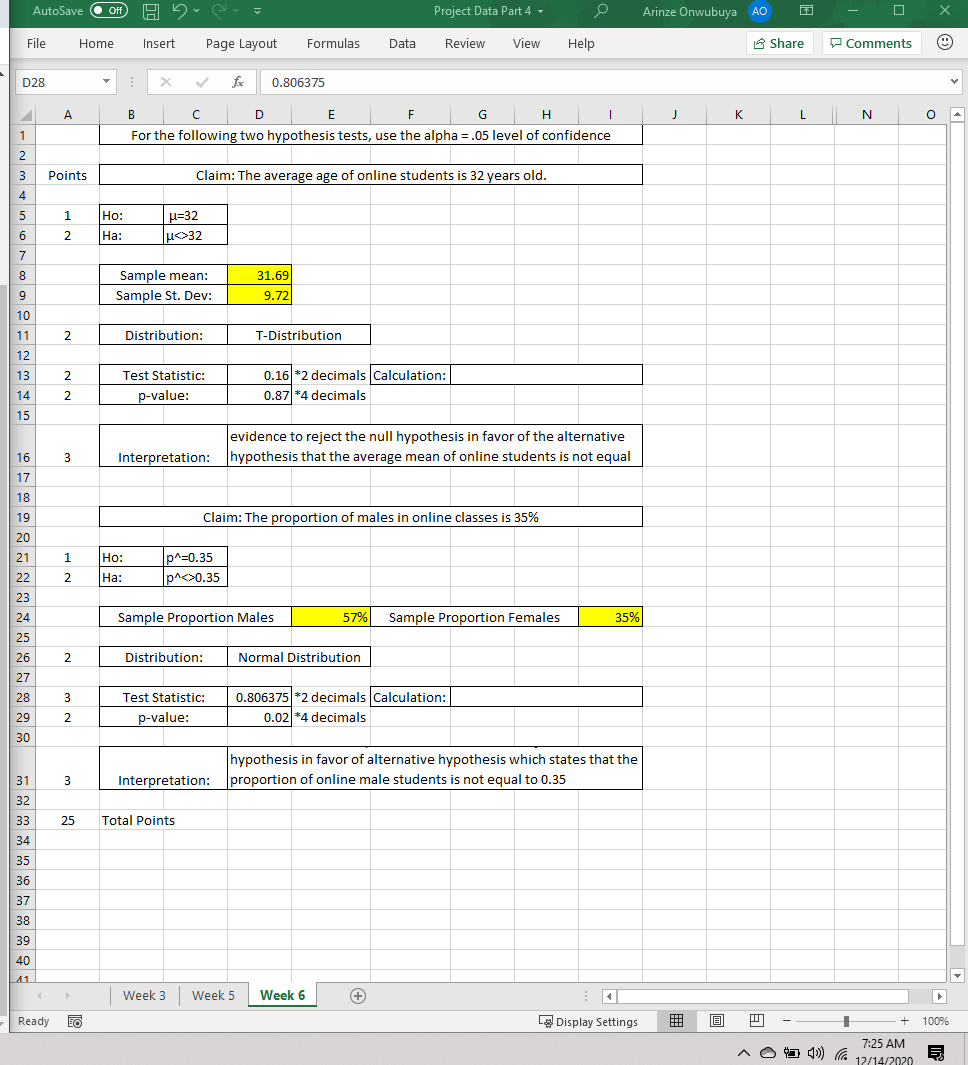
- Null and alternative hypothesis for both tests run for this project (in words)
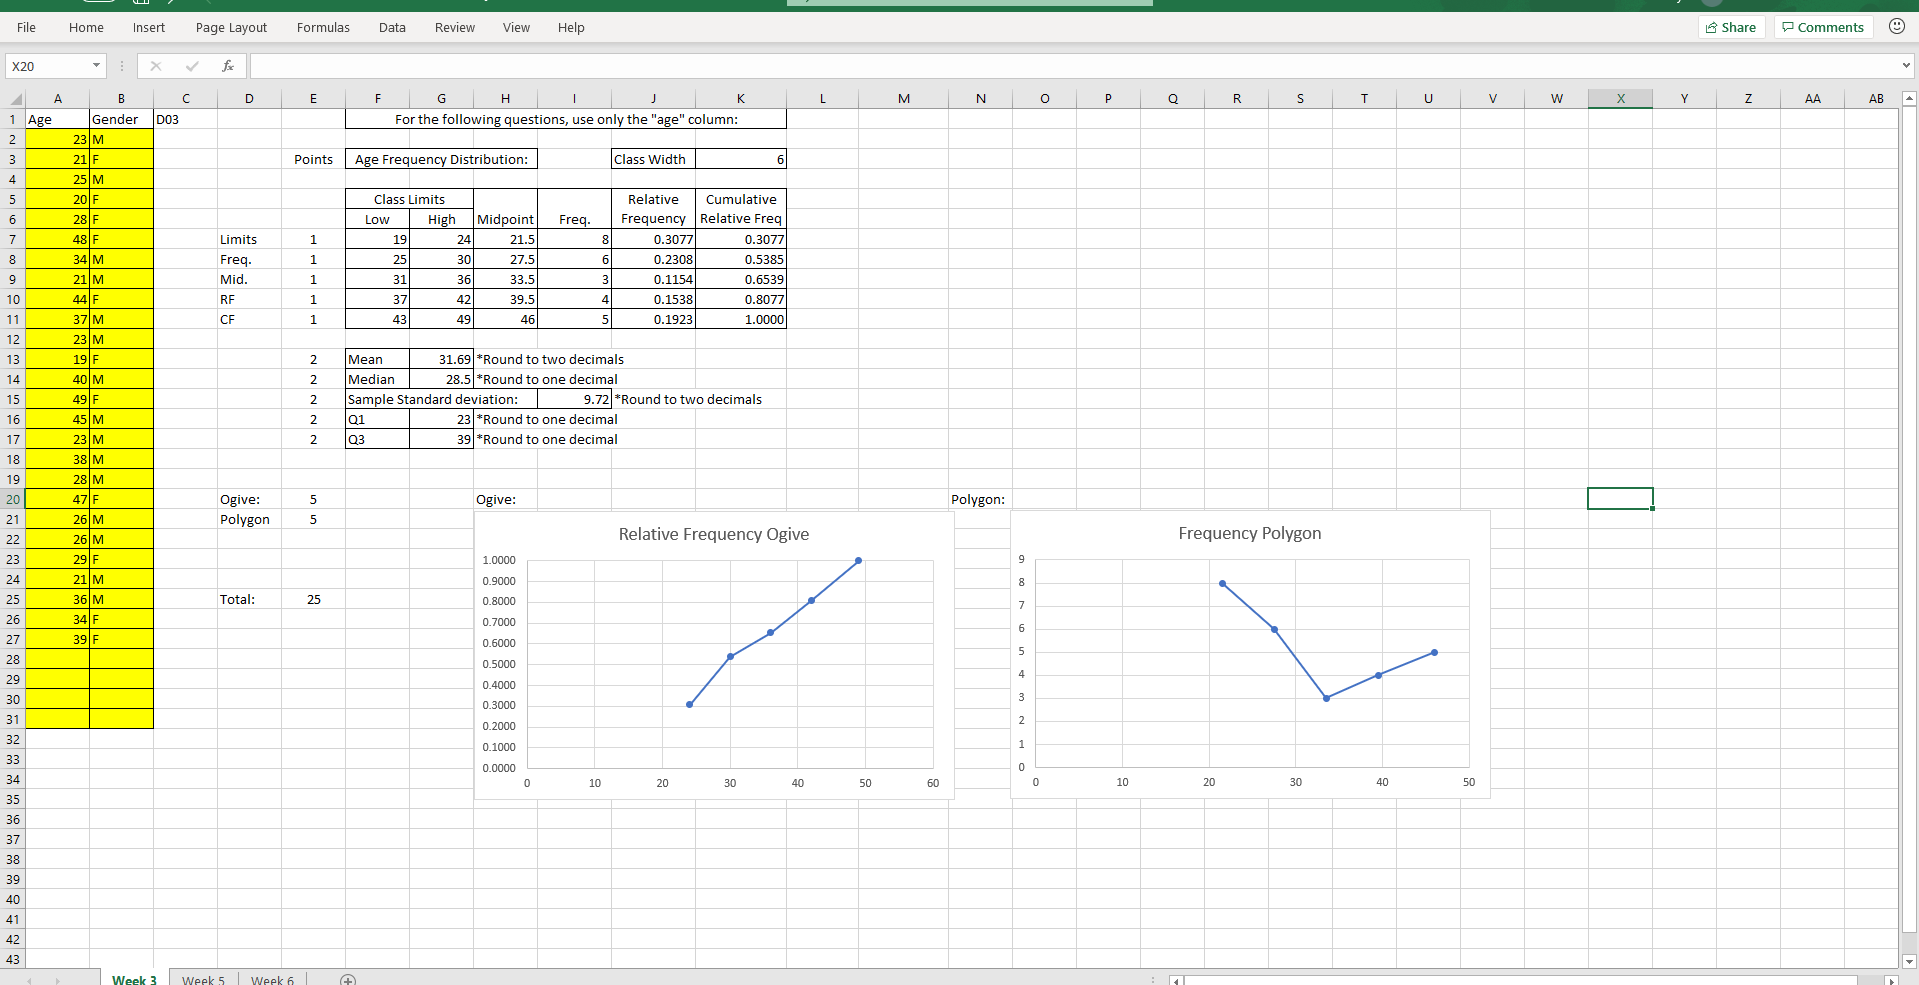
- address the claim about the mean):
- Summary of sample statistics (mean, median, quartiles)
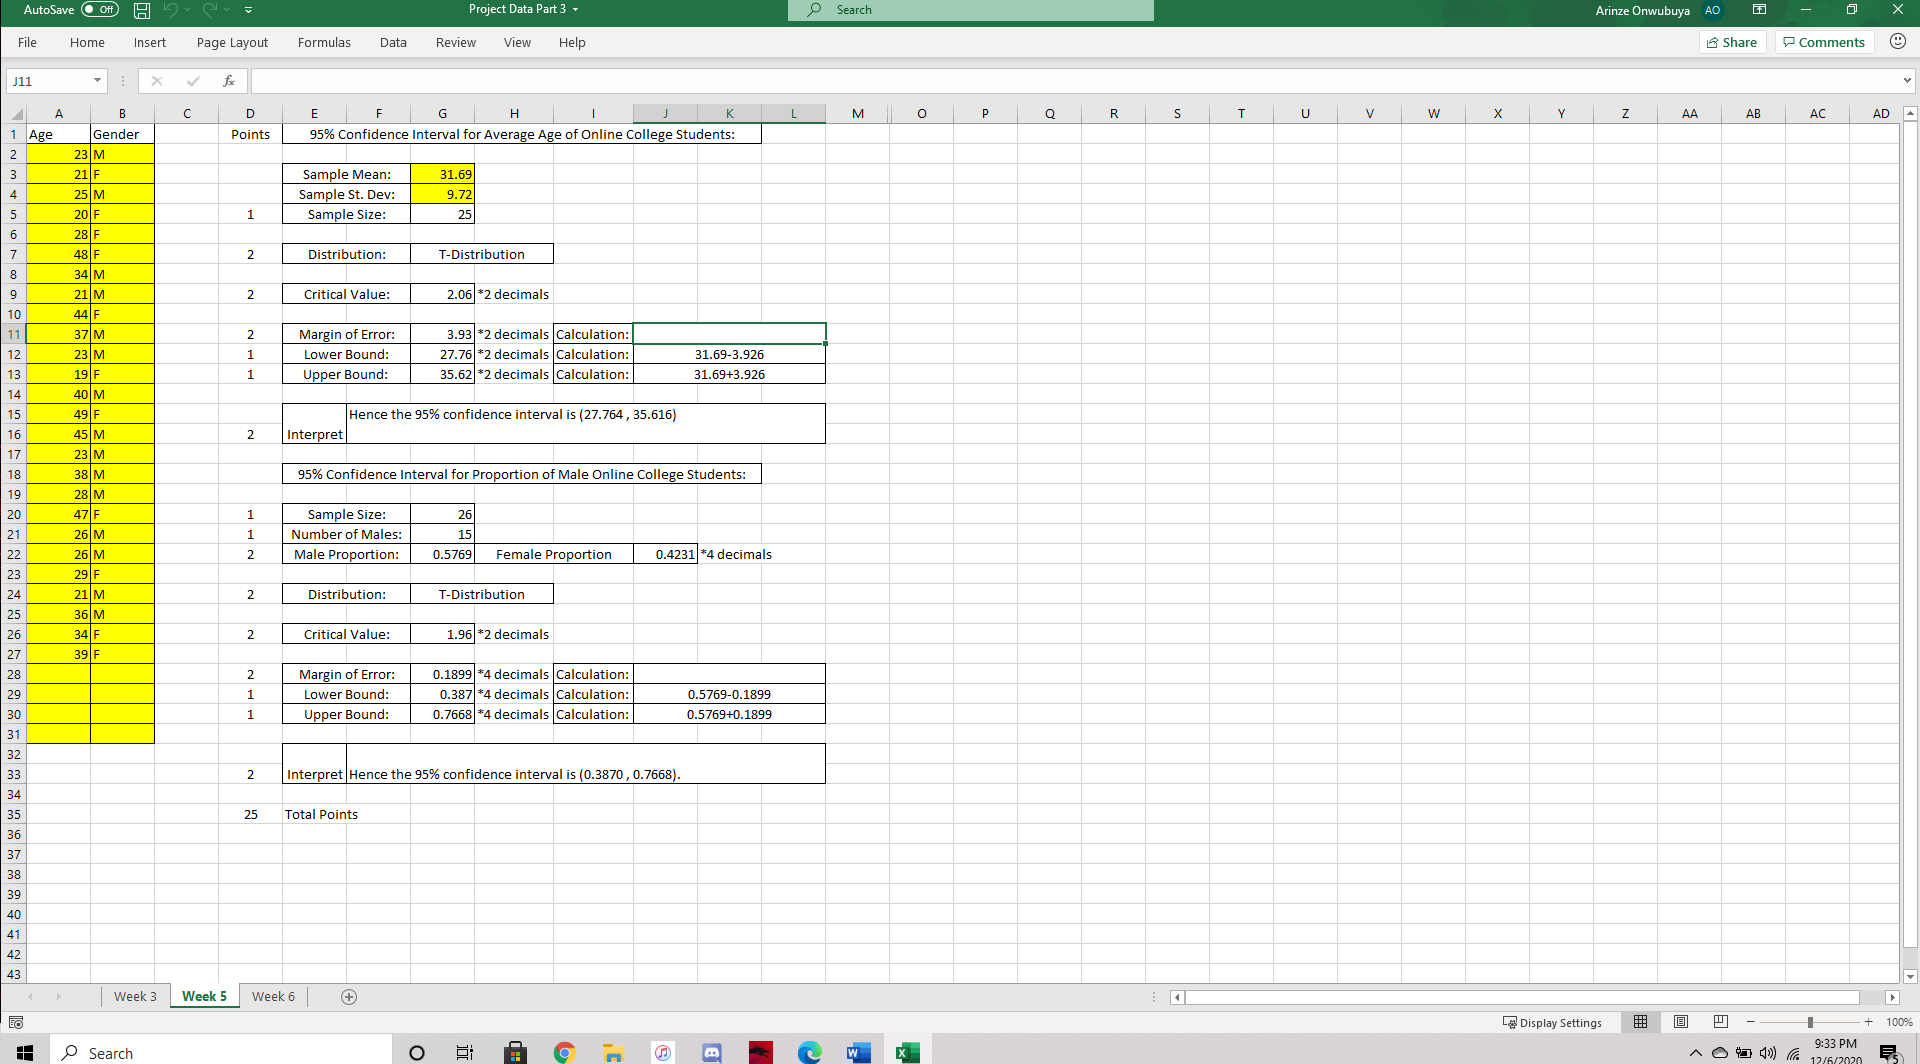
- Confidence interval, along with interpretation of the confidence interval
- Description of hypothesis test (alpha, test statistic, p-value, conclusion, interpretation)
- (address the claim about the proportion):
- Summary of sample statistics (x, n, and p)
- Confidence interval, along with interpretation of the confidence interval
- Description of hypothesis test (alpha, test statistic, p-value, conclusion, interpretation)
File Home Data View Help Share Comments Insert Page Layout Formulas Review X20 X V A R D E G H K M N P Q R S T U V W X Y Z AA AB 1 Age Gender DO3 For the following questions, use only the "age" column: 23 M 21 F Points Age Frequency Distribution: Class Width 25 M 20 Class Limits Relative Cumulative LD CO V Q UI A W N 28 F Low High Midpoint Freq. Frequency Relative Freq 48 F Limits 19 24 21. Co 0.3077 0.3077 34 M Freq. 25 30 27.5 0.2308 0.5385 21 M Mid. 31 36 $3.5 0.1154 0.6539 10 44 RF 37 42 39.5 0.1538 0.8077 11 37 M CF 43 49 46 0.1923 1.0000 12 23 M 13 19 2 Mean 31.69 #Round to two decimals 40 M 2 Median 28.5 #Round to one decimal 49 F N Sample Standard deviation: 9.72 *Round to two decimals 45 M Q1 23 *Round to one decimal 23 N 103 39 *Round to one decimal 38 N 28 47 F Ogive: Ogive: Polygon: 26 M Polygon 26 N Relative Frequency Ogive Frequency Polygon 29 F 1.0000 21 N 0.900 36 Total: 25 0.800 34 0.700 6 39 0.6000 0.5000 0.4000 0.3000 0.200 32 0.100 33 0.0000 34 0 10 20 30 40 50 60 0 10 20 30 40 50 35 36 37 38 39AutoSave . off) Project Data Part 3 - Search Arinze Onwubuya AO File Home Insert Page Layout Formulas Data Review View Help Share Comments J11 X A C D E G H M O P Q R S T U V W X Y Z AA AB AC AD 1 Age Gender Points 95% Confidence Interval for Average Age of Online College Students: 23 M 21 F Sample Mean: 31.69 25 M Sample St. Dev: 9.72 20 F Sample Size: 25 28 F 18 F 2 Distribution: T-Distribution W N = CO V Q UI A W N 34 M 21 M 2 Critical Value: 2.06 *2 decimals 44 F 37 M 2 Margin of Error: 3.93 #2 decimals Calculation: 23 M Lower Bound: 27.76 #2 decimals Calculation: 31.69-3.926 19 F Upper Bound: 35.62 #2 decimals Calculation: 31.69+3.926 10 M 49 F Hence the 95% confidence interval is (27.764 , 35.616) 45 M 2 Interpret 23 M 38 M 95% Confidence Interval for Proportion of Male Online College Students: 28 M 47 F Sample Size: 26 26 M Number of Males: 15 26 M Male Proportion: 0.5769 Female Proportion 0.4231 *4 decimals 29 F 21 M 2 Distribution: T-Distribution 36 M 34 F 2 Critical Value: 1.96 *2 decimals 39 F IN Margin of Error: 0.1899 #4 decimals Calculation: Lower Bound: 0.387 *4 decimals Calculation: 0.5769-0.1899 Upper Bound: 0.7668 #4 decimals Calculation: 0.5769+0.1899 2 Interpret Hence the 95% confidence interval is (0.3870 , 0.7668). 25 Total Points 43 Week 3 Week 5 Week 6 + Display Settings + 100% Search O On w X 9:33 PM.- -. File Home Insert Page Layout Formulas Data Review View Help 6 Share 'F' Comments ' E28 v 1': 0.805376 v AAE|C|D|E|F|G|H|IJ|K|L||N|OA 1 | For the following two hvpothesis tests, use the alpha 2 .05 level of confidence | 2 3 Points Claim: The average age of online students is 32 years old. 4 5 1 Ho: [1:32 6 2 Ha: p32 T 8 Sample mean: 31.59 9 Sample St. Dev: 9.?2 10 11 2 Distribution: TDistribution 12 13 2 Teststatistic: 0.16 *2 decimals Calculation: 14 2 pvalue: 0.8? *4 decimals 15 evidence to reject the null hypothesis in favor of the alternative 16 3 Interpretation: hypothesis that the average mean of online students is not equal 17 18 19 Claim: The proportion of males in online classes is 35% 20 21 1 Ho: p\"=0.35 22 2 Ha: pno.35 23 24 Sample Proportion Males 53% Sample Proportion Females 35% 25 26 2 I Distribution: Normal Distribution 27 28 3 Teststatistic: 0.806335 *2 decimals Calculation: 29 2 pvalue: 0.02 '4 decimals 30 hypothesis in favor of alternative hypothesis which states that the 31 3 Interpretation: proportion of online male students is not equal to 0.35 32 33 25 Total Points 34 35 36 37 38 39 40 F I Week 3 Week 5 Week 6 E) E 4 | lL 7 Ready '3 Display Settings 'n El Fl I l 100% "#25 AM A a E $3} f 1mm E
Step by Step Solution
There are 3 Steps involved in it

Get step-by-step solutions from verified subject matter experts