

Question: With this data, I need help filling out these two worksheets (#3 and #4 on the instructions): With this data, I need help filling out
With this data, I need help filling out these two worksheets (#3 and #4 on the instructions): 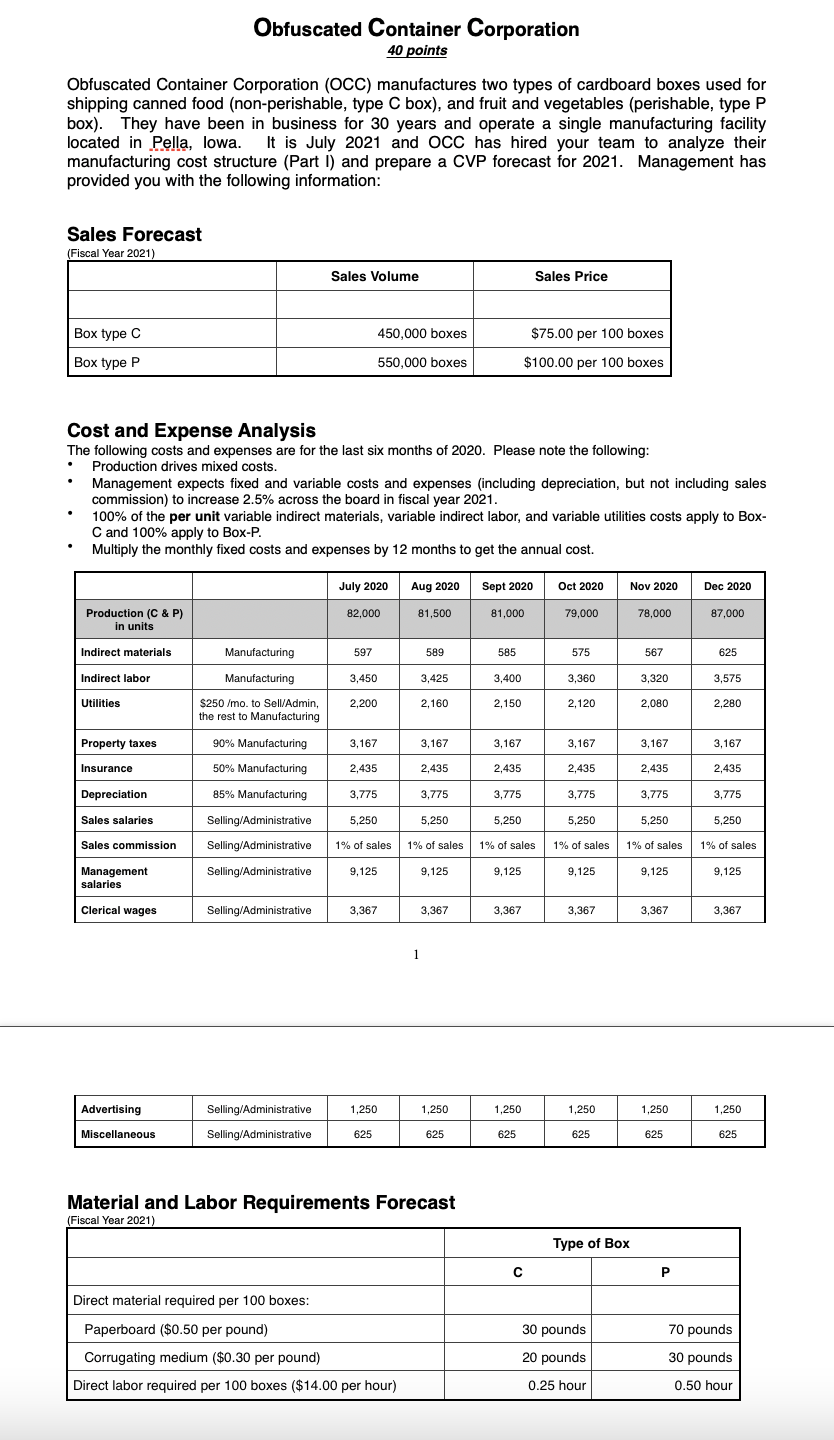
 With this data, I need help filling out these two worksheets (#3 and #4 on the instructions):
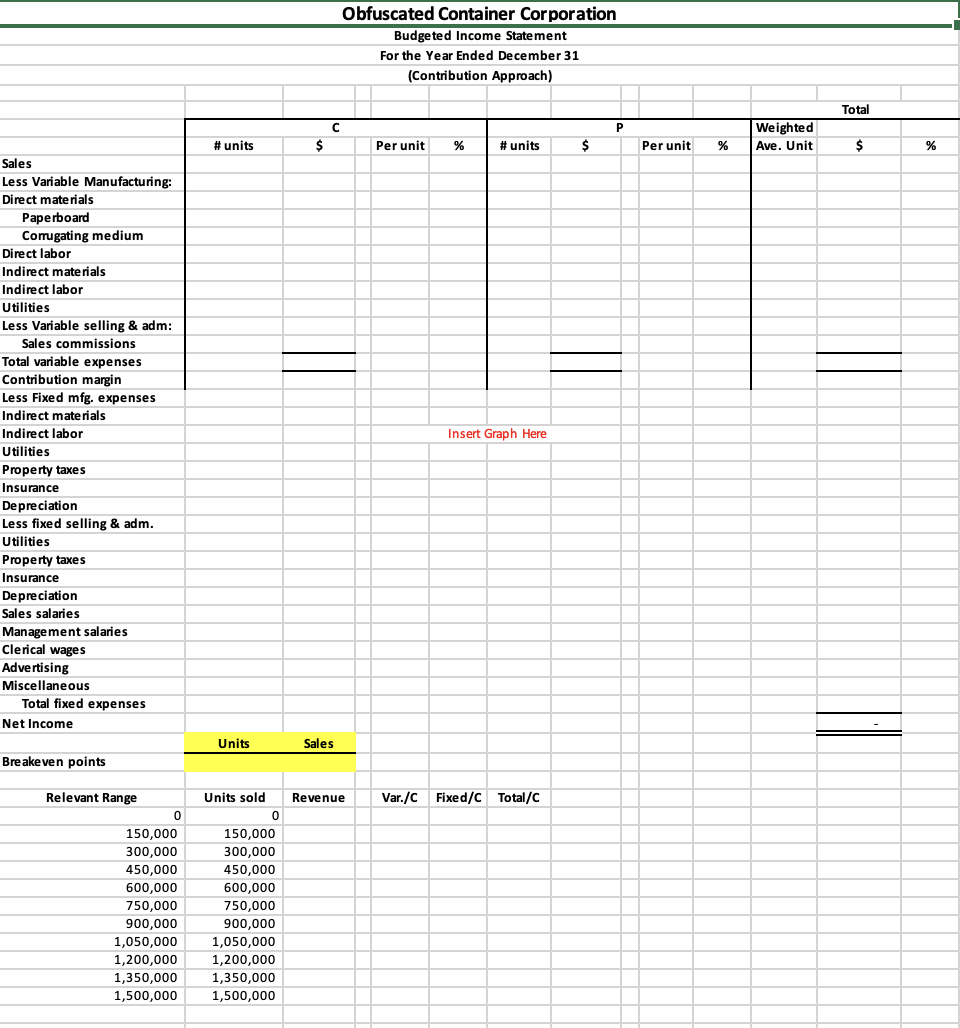
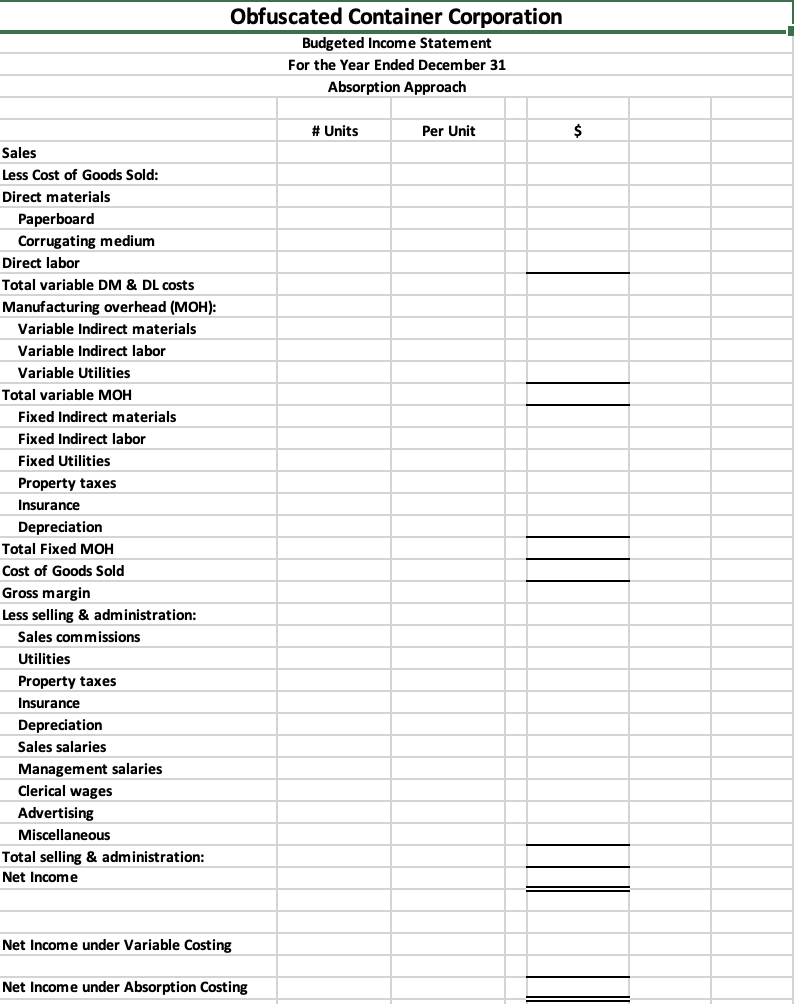
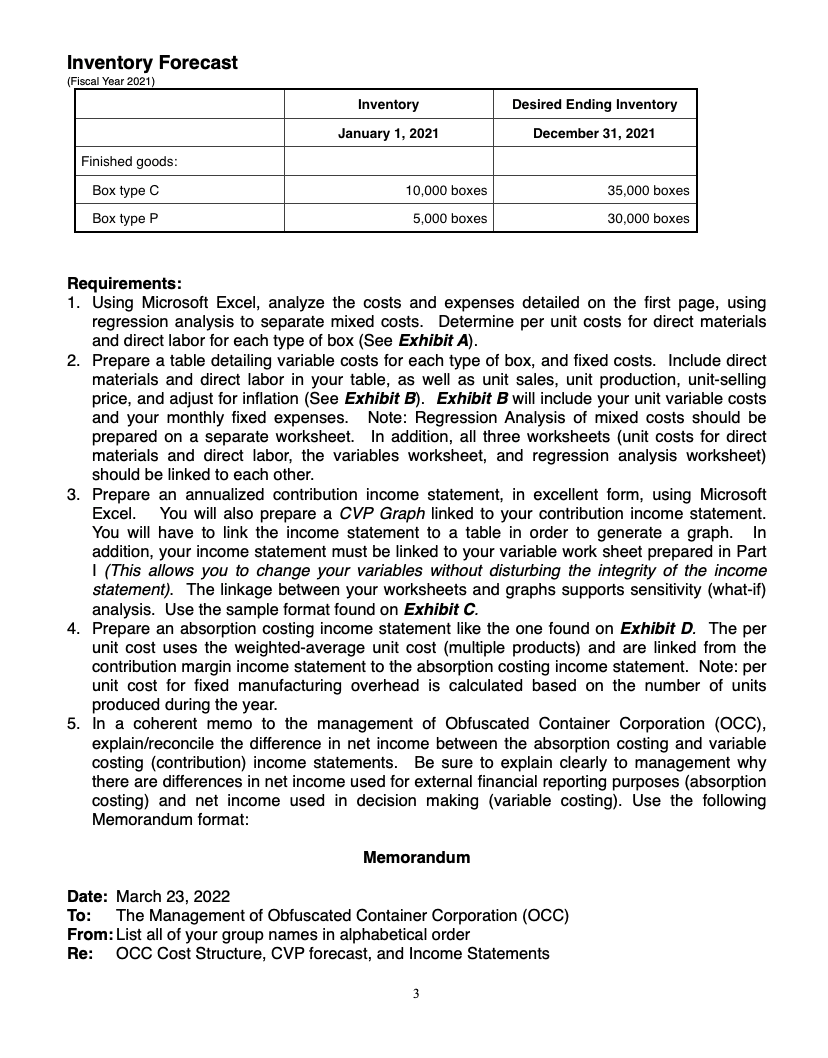
Obfuscated Container Corporation 40 points Obfuscated Container Corporation (OCC) manufactures two types of cardboard boxes used for shipping canned food (non-perishable, type C box), and fruit and vegetables (perishable, type P box). They have been in business for 30 years and operate a single manufacturing facility located in Pella, lowa. It is July 2021 and OCC has hired your team to analyze their manufacturing cost structure (Part 1) and prepare a CVP forecast for 2021. Management has provided you with the following information: Sales Forecast (Fiscal Year 2021) ( Sales Volume Sales Price Box type C 450,000 boxes $75.00 per 100 boxes Box type P 550,000 boxes $100.00 per 100 boxes Cost and Expense Analysis The following costs and expenses are for the last six months of 2020. Please note the following: Production drives mixed costs. Management expects fixed and variable costs and expenses (including depreciation, but not including sales commission) to increase 2.5% across the board in fiscal year 2021. 100% of the per unit variable indirect materials, variable indirect labor, and variable utilities costs apply to Box- C and 100% apply to Box-P. Multiply the monthly fixed costs and expenses by 12 months to get the annual cost. July 2020 Aug 2020 Sept 2020 Oct 2020 Nov 2020 Dec 2020 82,000 81,500 Production (C & P) in units 81,000 79,000 78,000 87,000 Indirect materials Manufacturing 597 589 585 575 567 625 Indirect labor 3,450 3,425 3,400 3,360 3,320 3,575 Utilities Manufacturing $250 /mo. to Sell/Admin /, the rest to Manufacturing 2,200 2,160 2,150 2,120 2,080 2,280 Property taxes 90% Manufacturing 3,167 3,167 3,167 3,167 3,167 3,167 Insurance 50% Manufacturing 2,435 2,435 2,435 2,435 2,435 2,435 Depreciation 3,775 3,775 3,775 3,775 3,775 3,775 85% Manufacturing % Selling/Administrative Sales salaries 5.250 5,250 5,250 5,250 5,250 5,250 Sales commission Selling/Administrative 1% of sales 1% of sales 1% of sales 1% of sales 1% of sales 1% of sales Selling/Administrative 9,125 9,125 9,125 9,125 9,125 9,125 Management salaries Clerical wages Selling/Administrative 3,367 3,367 3,367 3,367 3.367 3,367 1 Advertising Selling/Administrative 1,250 1,250 1,250 1.250 1.250 1,250 Miscellaneous Selling/Administrative 625 625 625 625 625 625 Material and Labor Requirements Forecast (Fiscal Year 2021) Type of Box P Direct material required per 100 boxes: 30 pounds 70 pounds Paperboard ($0.50 per pound) Corrugating medium ($0.30 per pound) Direct labor required per 100 boxes ($14.00 per hour) 20 pounds 30 pounds 0.25 hour 0.50 hour Inventory Forecast (Fiscal Year 2021) Inventory Desired Ending Inventory January 1, 2021 December 31, 2021 Finished goods: Box type C 10,000 boxes 35.000 boxes Box type P 5,000 boxes 30,000 boxes Requirements: 1. Using Microsoft Excel, analyze the costs and expenses detailed on the first page, using regression analysis to separate mixed costs. Determine per unit costs for direct materials and direct labor for each type of box (See Exhibit A). 2. Prepare a table detailing variable costs for each type of box, and fixed costs. Include direct materials and direct labor in your table, as well as unit sales, unit production, unit-selling price, and adjust for inflation (See Exhibit B). Exhibit B will include your unit variable costs and your monthly fixed expenses. Note: Regression Analysis of mixed costs should be prepared on a separate worksheet. In addition, all three worksheets (unit costs for direct materials and direct labor, the variables worksheet, and regression analysis worksheet) should be linked to each other. 3. Prepare an annualized contribution income statement, in excellent form, using Microsoft Excel. You will also prepare a CVP Graph linked to your contribution income statement. You will have to link the income statement to a table in order to generate a graph. In addition, your income statement must be linked to your variable work sheet prepared in Part I (This allows you to change your variables without disturbing the integrity of the income statement). The linkage between your worksheets and graphs supports sensitivity (what-if) analysis. Use the sample format found on Exhibit C. 4. Prepare an absorption costing income statement like the one found on Exhibit D. The per unit cost uses the weighted average unit cost (multiple products) and are linked from the contribution margin income statement to the absorption costing income statement. Note: per unit cost for fixed manufacturing overhead is calculated based on the number of units produced during the year. 5. In a coherent memo to the management of Obfuscated Container Corporation (OCC), explain/reconcile the difference in net income between the absorption costing and variable costing (contribution) income statements. Be sure to explain clearly to management why there are differences in net income used for external financial reporting purposes (absorption costing) and net income used in decision making (variable costing). Use the following Memorandum format: Memorandum Date: March 23, 2022 To: The Management of Obfuscated Container Corporation (OCC) From: List all of your group names in alphabetical order Re: OCC Cost Structure, CVP forecast, and Income Statements 3 Obfuscated Container Corporation Budgeted Income Statement For the Year Ended December 31 (Contribution Approach) Total P $ Weighted Ave. Unit #units Per unit % #units $ Per unit % $ % % Insert Graph Here Sales Less Variable Manufacturing: Direct materials Paperboard Corrugating medium Direct labor Indirect materials Indirect labor Utilities Less Variable selling & adm: Sales commissions Total variable expenses Contribution margin Less Fixed mfg. expenses Indirect materials Indirect labor Utilities Property taxes Insurance Depreciation Less fixed selling & adm. Utilities Property taxes Insurance Depreciation Sales salaries Management salaries Clerical wages Advertising Miscellaneous Total fixed expenses Net Income Units Sales Breakeven points Revenue Var./C Fixed/C Total/C Relevant Range 0 150,000 300,000 450,000 600,000 750,000 900,000 1,050,000 1,200,000 1,350,000 1,500,000 Units sold 0 150,000 300,000 450,000 600,000 750,000 900,000 1,050,000 1,200,000 1,350,000 1,500,000 Obfuscated Container Corporation Budgeted Income Statement For the Year Ended December 31 Absorption Approach # Units Per Unit $ Sales Less Cost of Goods Sold: Direct materials Paperboard Corrugating medium Direct labor Total variable DM & DL costs Manufacturing overhead (MOH): Variable Indirect materials Variable Indirect labor Variable Utilities Total variable MOH Fixed Indirect materials Fixed Indirect labor Fixed Utilities Property taxes Insurance Depreciation Total Fixed MOH Cost of Goods Sold Gross margin Less selling & administration: Sales commissions Utilities Property taxes Insurance Depreciation Sales salaries Management salaries Clerical wages Advertising Miscellaneous Total selling & administration: Net Income Net Income under Variable Costing Net Income under Absorption Costing
Step by Step Solution
There are 3 Steps involved in it

Get step-by-step solutions from verified subject matter experts