

Question: With what do we create the histogram? Frequently and boundaries? struct a histogram corresponding to the frequency table below. Be sure to label your izontal
With what do we create the histogram? Frequently and boundaries?
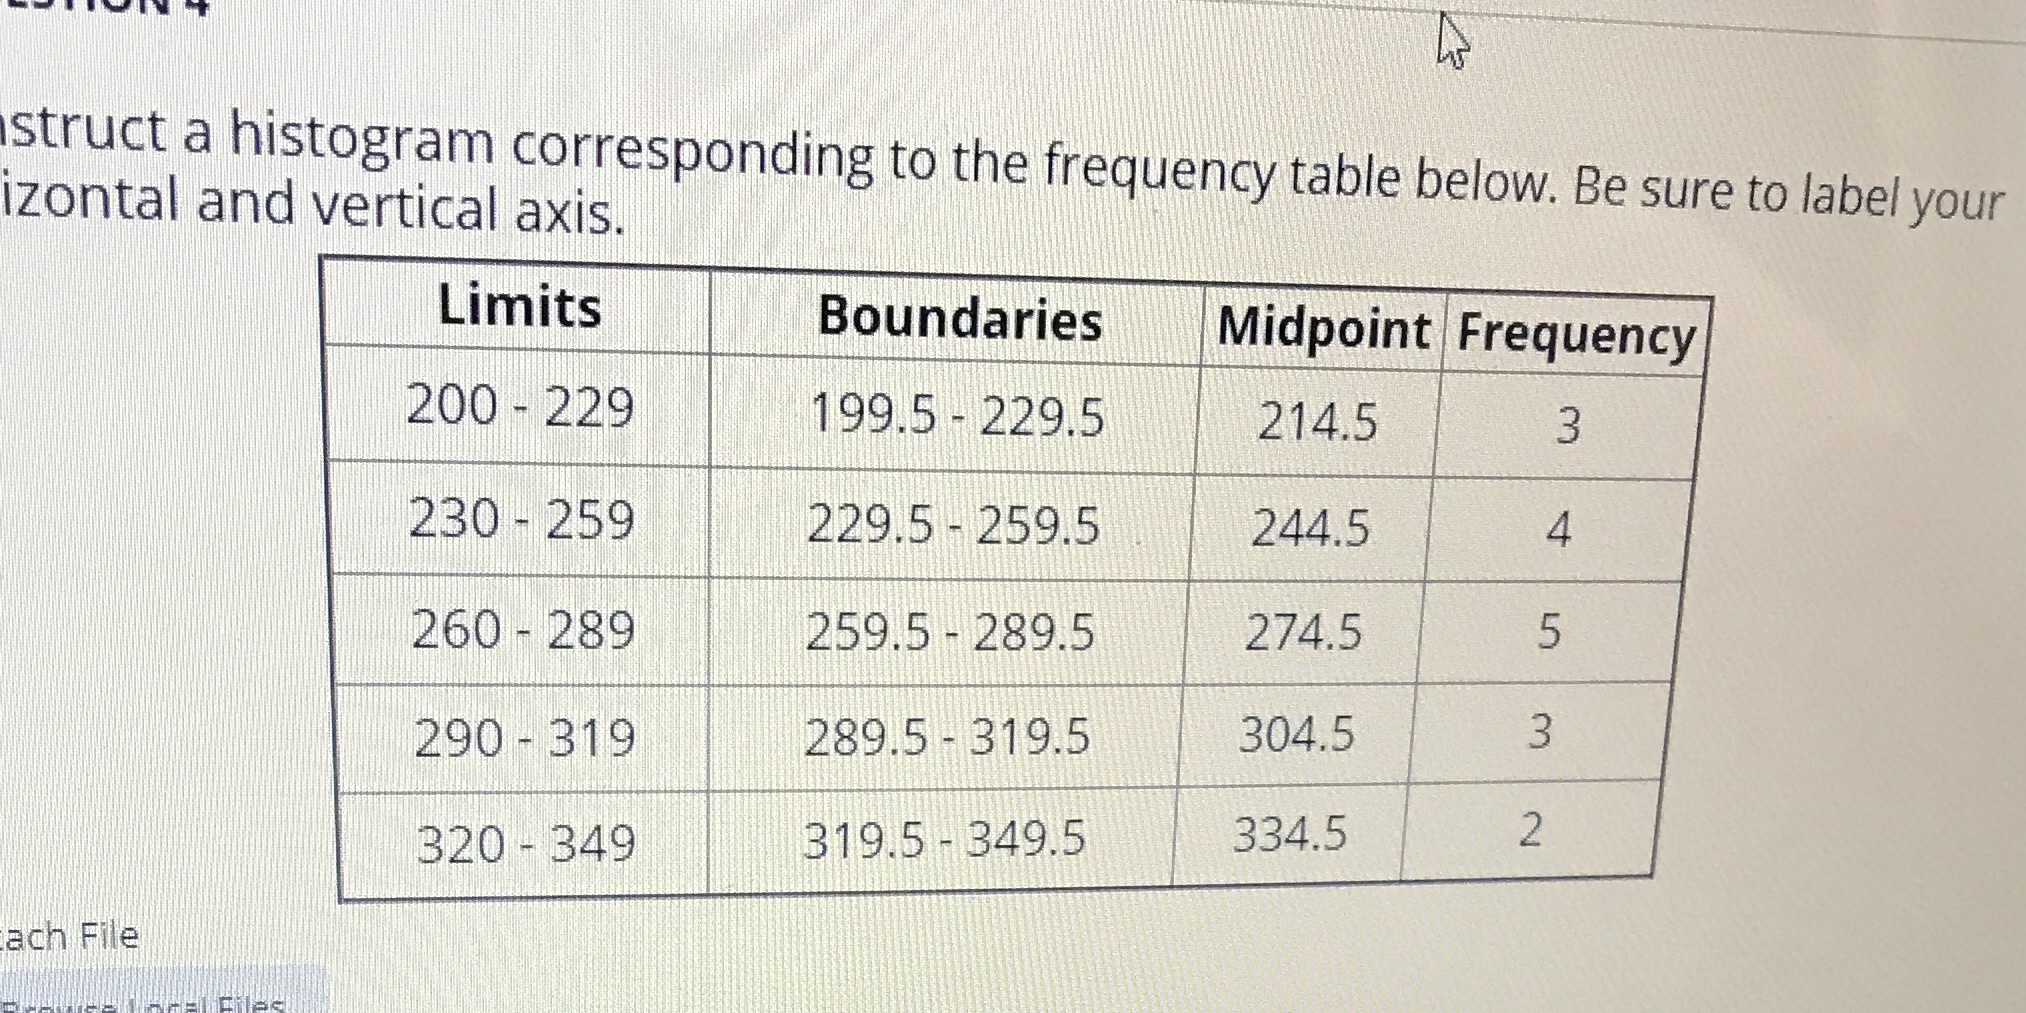
struct a histogram corresponding to the frequency table below. Be sure to label your izontal and vertical axis. Limits Boundaries Midpoint Frequency 200 - 229 199.5 - 229.5 214.5 230 - 259 229.5 - 259.5 244.5 4 260 - 289 259.5 - 289.5 274.5 5 290 - 319 289.5 - 319.5 304.5 3 319.5 - 349.5 334.5 2 320 - 349 ach File
Step by Step Solution
There are 3 Steps involved in it
1 Expert Approved Answer
Step: 1 Unlock

Question Has Been Solved by an Expert!
Get step-by-step solutions from verified subject matter experts
Step: 2 Unlock
Step: 3 Unlock