

Question: Within this activity, you'll have an opportunity to practice visualizing information for a specific audience and purpose. Below is an example student activity, but please
Within this activity, you'll have an opportunity to practice visualizing information for a specific audience and purpose. Below is an example student activity, but please only use that as a guide. Your table should be organized and designed based on YOUR style.
Context
Assume that you work for PLANET (the Professional Landcare Network), a professional association for landscape designers and contractors. You have been asked to create a table for the organization's website, landcarenetwork.org, that shows the seasonal lawn-maintenance tasks landscape services or homeowners might perform over the period of one year.
Your Task
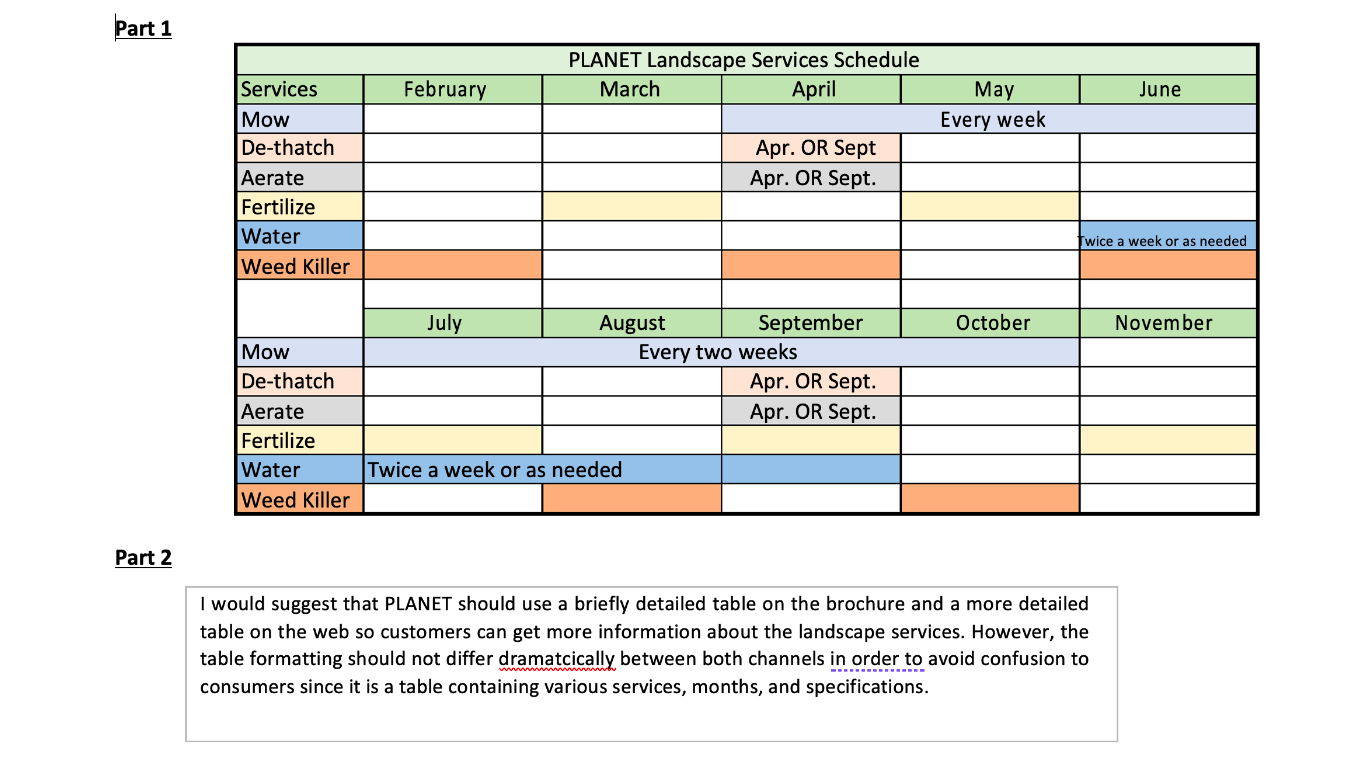
Part 1
Use the following information to create your table:
Mow: April to June (every week), July and August (every two weeks), and September to October (every 2 weeks)
De-thatch: April or September
Aerate: April or September
Fertilize: March, May, July, September, November
Water: Twice a week June through September, or as needed
Apply weed killer: February, April, June, August, October
Part 2
Answer the following question: If PLANET organizers were also considering using your table in their new brochure, what design or formatting differences would you suggest between the web and print tables?
Screenshot of student sample (ignore some of their misspelling):
Step by Step Solution
There are 3 Steps involved in it

Get step-by-step solutions from verified subject matter experts