

Question: wo dot plots are ization distributions taken same population. One was taking samples of size 10 and r was made by taking samples 0. Which
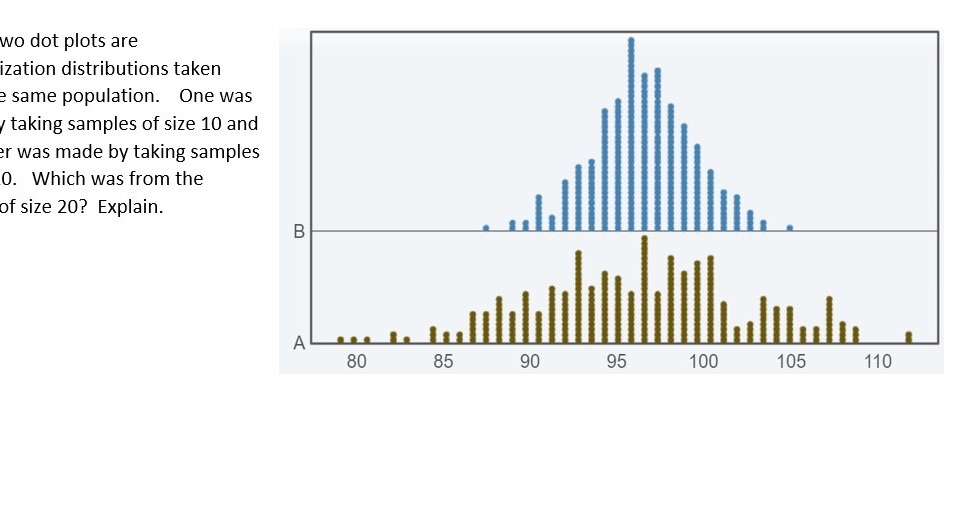
wo dot plots are ization distributions taken same population. One was taking samples of size 10 and r was made by taking samples 0. Which was from the of size 20? Explain. B A 80 85 90 95 100 105 110
Step by Step Solution
There are 3 Steps involved in it
1 Expert Approved Answer
Step: 1 Unlock

Question Has Been Solved by an Expert!
Get step-by-step solutions from verified subject matter experts
Step: 2 Unlock
Step: 3 Unlock