

Question: WO years: est to - X i Data Table 2019 2018 Net revenues. $ 380 $ 270 $ 135 $ 150 Cost of goods sold
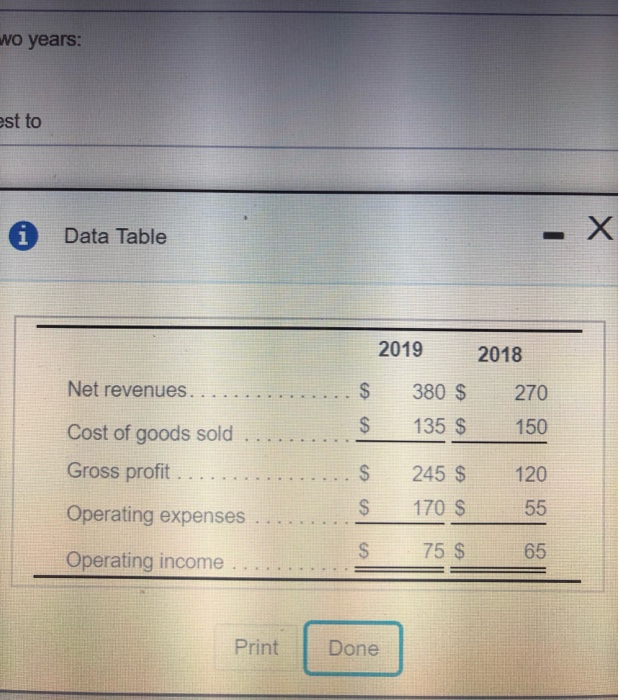
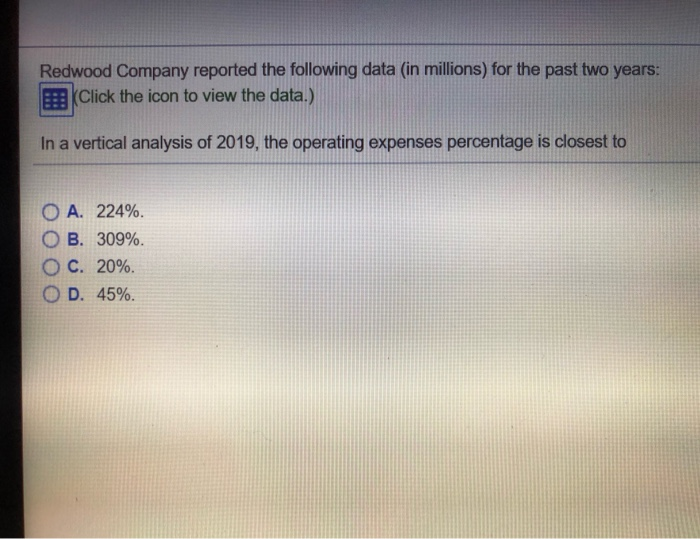
WO years: est to - X i Data Table 2019 2018 Net revenues. $ 380 $ 270 $ 135 $ 150 Cost of goods sold Gross profit 245 $ 120 170 $ 55 Operating expenses 75 $ 65 Operating income Print Done Redwood Company reported the following data (in millions) for the past two years: Click the icon to view the data.) In a vertical analysis of 2019, the operating expenses percentage is closest to O A. 224% B. 309% O C. 20%. D. 45%
Step by Step Solution
There are 3 Steps involved in it
1 Expert Approved Answer
Step: 1 Unlock

Question Has Been Solved by an Expert!
Get step-by-step solutions from verified subject matter experts
Step: 2 Unlock
Step: 3 Unlock