

Question: Word File Edit View Insert Format Tools Table Window Help 84% Wed 11:07 AM AutoSave OFF HW8-042824-Saved to my Mac Home Insert Draw Design
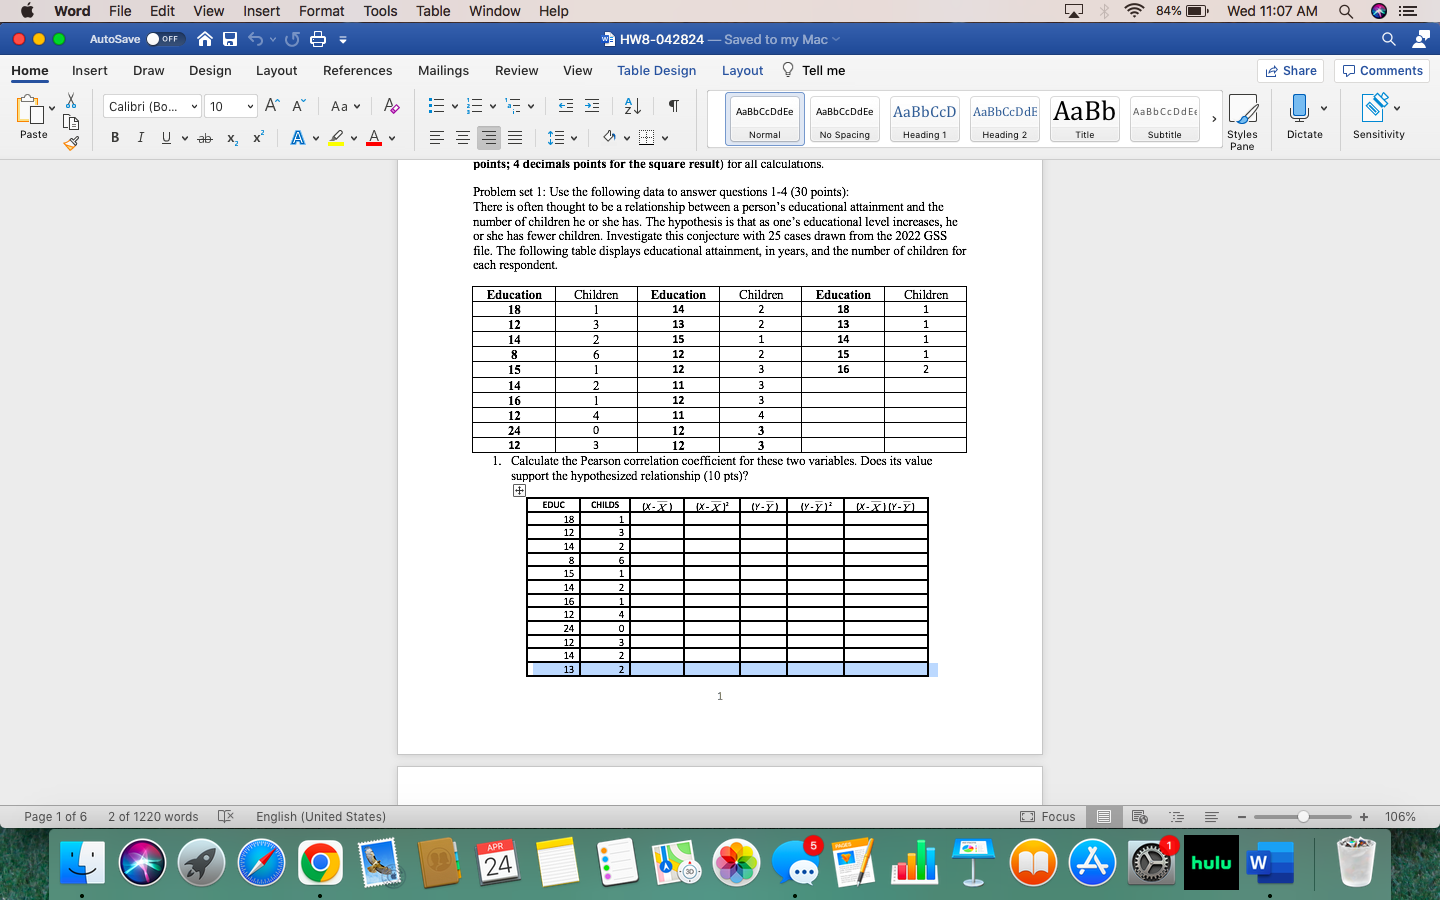
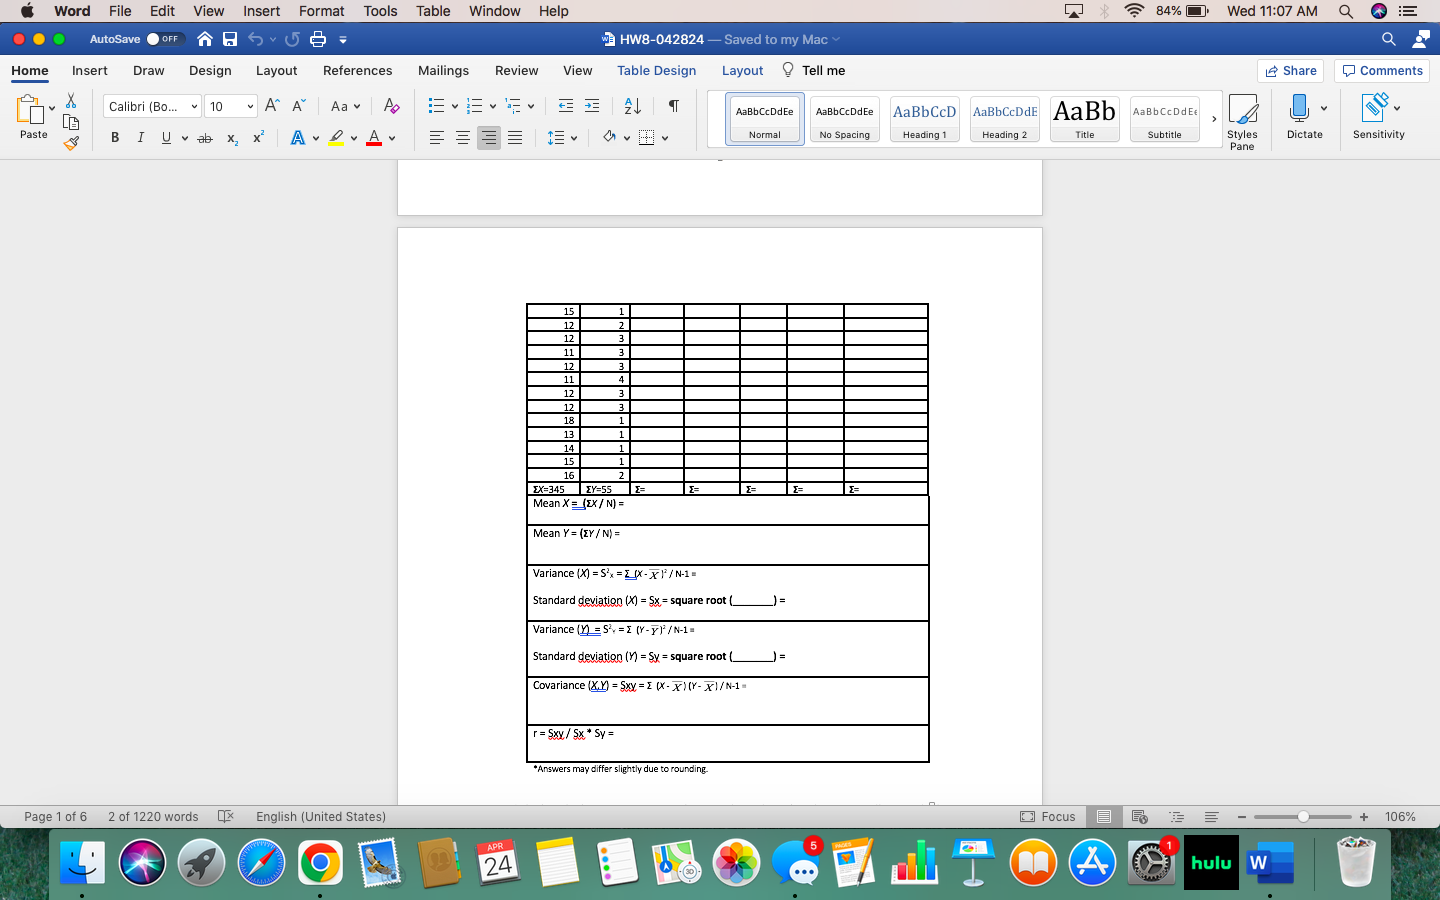
Word File Edit View Insert Format Tools Table Window Help 84% Wed 11:07 AM AutoSave OFF HW8-042824-Saved to my Mac Home Insert Draw Design Layout References Mailings Review View Table Design Layout Tell me Share Comments < Calibri (Bo... 10 v A A Aa 2 Paste BIU ab x A A = AaBbCcDdEe Normal AaBbCcDdEe AaBbCcD AaBbCcDdE AaBb AaBbCcDdEe No Spacing Heading 1 Heading 2 Title Subtitle Styles Dictate Sensitivity Pane Page 1 of 6 2 of 1220 words English (United States) points; 4 decimals points for the square result) for all calculations. Problem set 1: Use the following data to answer questions 1-4 (30 points): There is often thought to be a relationship between a person's educational attainment and the number of children he or she has. The hypothesis is that as one's educational level increases, he or she has fewer children. Investigate this conjecture with 25 cases drawn from the 2022 GSS file. The following table displays educational attainment, in years, and the number of children for each respondent. Education Children Education Children Education Children 18 1 14 2 18 1 12 3 13 2 13 1 14 2 15 1 14 1 8 6 12 2 15 1 15 1 12 3 16 2 14 2 11 3 16 1 12 3 12 4 11 4 24 0 12 3 12 12 3 3 1. Calculate the Pearson correlation coefficient for these two variables. Does its value support the hypothesized relationship (10 pts)? APR 24 EDUC CHILDS (x-x) (X-XP (Y-Y) (Y-Y) X-X) (Y-Y) 18 1 12 3 14 2 6 15 1 14 2 16 1 12 4 24 0 12 3 14 2 13 2 1 Focus A hulu W + 106% Word File Edit View Insert Format Tools Table Window Help AutoSave OFF HW8-042824-Saved to my Mac Home Insert Draw Design Layout References Mailings Review View Table Design Layout Tell me < Calibri (Bo... 10 v A A Aa 2 AaBbCcDdEe Paste BIU ab x A A Page 1 of 6 2 of 1220 words English (United States) APR 24 84% Wed 11:07 AM Share Comments AaBbCcDdEe AaBbCcD AaBbCcDdE AaBb AaBbCcDdEe Normal No Spacing Heading 1 Heading 2 Title Subtitle Styles Pane Dictate Sensitivity 15 1 12 2 12 3 11 3 12 3 11 4 12 3 12 3 18 1 13 1 14 1 15 1 16 2 EX-345 EY=55 = = = Mean X = (EX/N) = Mean Y (Y/N) = Variance (X) Sx = (x-x1 / N-1= Standard deviation (X) =Sx=square root Variance (Y) S = (Y-Y)/N-1= = Standard deviation (Y) - Sy-square root Covariance (X,Y) = Sxy = (xx) (Y-X)/N-1 = r = Sxy / Sx* Sy= *Answers may differ slightly due to rounding. 5 Focus A hulu W + 106%
Step by Step Solution
There are 3 Steps involved in it

Get step-by-step solutions from verified subject matter experts