

Question: Word File Edit View Insert Format Tools Table Window Help 44% D. Sun 2:11 PM Q DE AutoSave . OFF HW8-042824 ~ a Dy Home
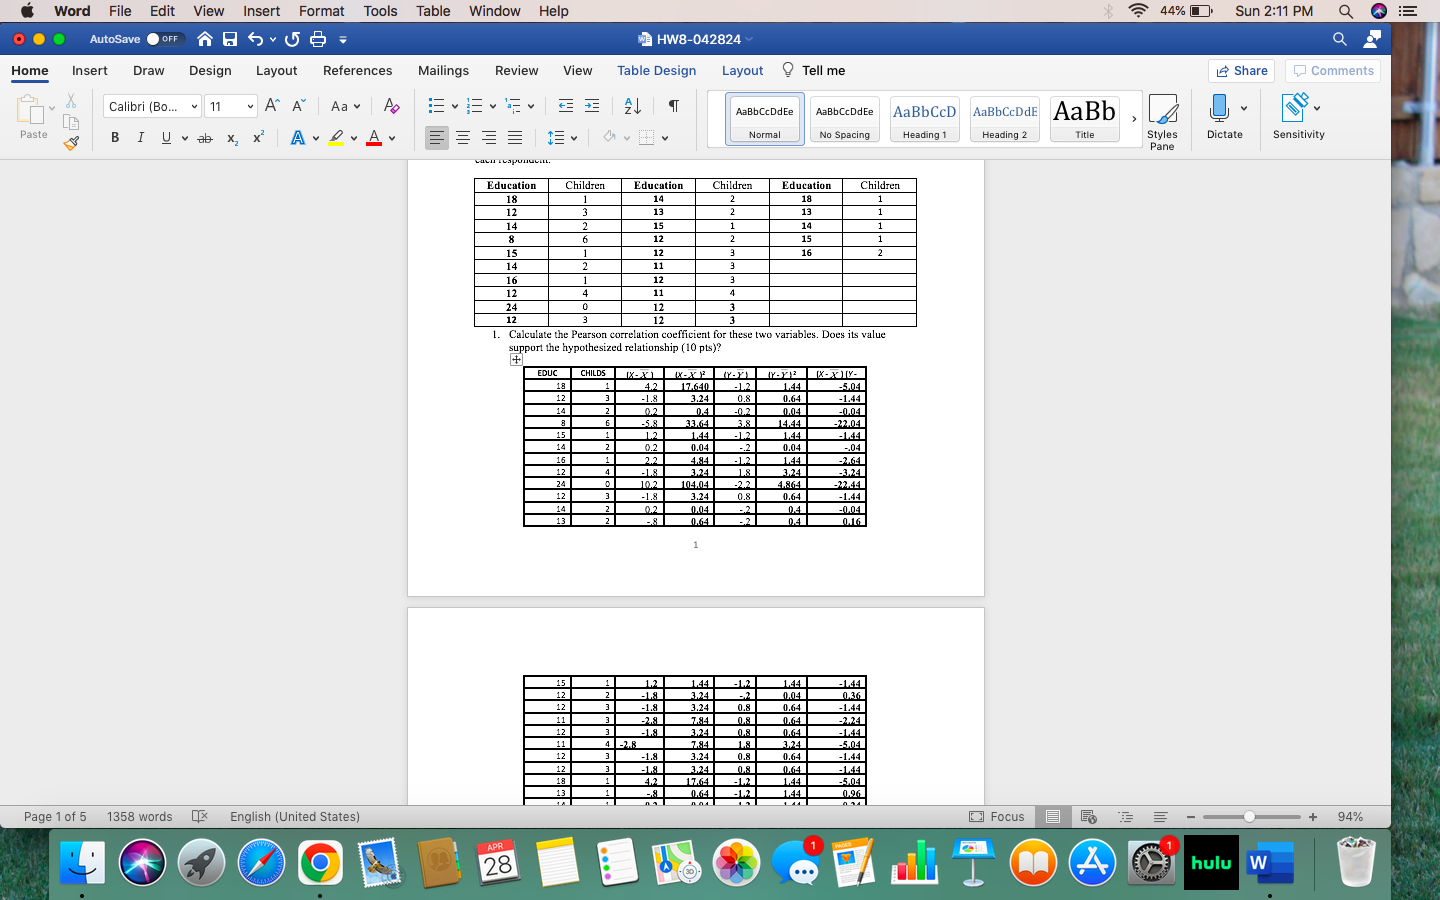
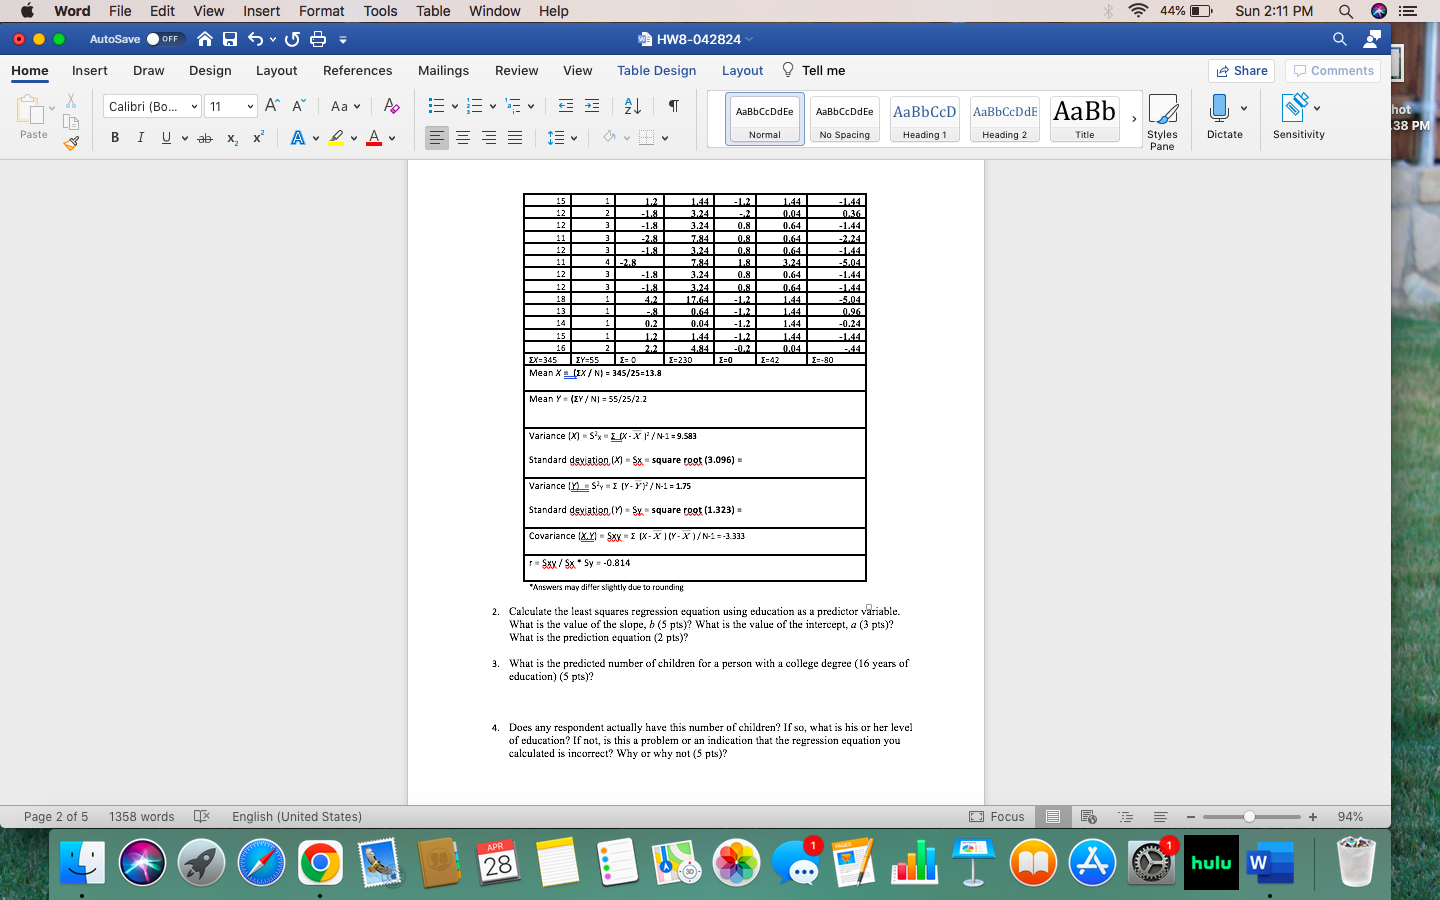
Word File Edit View Insert Format Tools Table Window Help 44% D. Sun 2:11 PM Q DE AutoSave . OFF HW8-042824 ~ a Dy Home Insert Draw Design Layout References Mailings Review View Table Design Layout ? Tell me Share Comments Calibri (BO.. * 11 A A Aa A 24 AaBbCcDdEe AaBbCcDdEe AaBbCCD AaBbCcDdE AaBb Paste BI Uvab x x A LA EE E IEV Normal No Spacing Heading 1 Heading 2 Title Styles Dictate Sensitivity Pane Education Children Education Children Education Children 18 1 14 18 12 3 14 8 - ON 15 16 14 16 12 24 12 1. Calculate the Pearson correlation coefficient for these two variables. Does its value support the hypothesized relationship (10 pts)? EDUC CHILDS X XXX (YY Y YZ|K-XY- 18 4.2 17.640 -1.21 1.44 12 -504 -1.8 3.24 0.8 0.64 -1.44 14 021 04 -021 0.04 -0.04 -5.8 33.64 3 8 T 14.44 -32.04 1.2 1.44 -12 1.44 -1.44 0.2 0.04 -2 0.04 -.04 2.2 4.84 -1.2 1.44 1 -2.64 -18 3.24 3.24 -3.24 102 104.04 -2.2 4.864 -32.44 -1.8 3.24 0.8 0.64 -1.44 021 0.04 04 -0.04 -81 0.64 0.4 0.16 2 12 1.44 1.44 -18 3.24 -1.44 0.04 1.24 0.36 0.8 0.64 -1.44 --2.8 7.84 0.81 0.64 -2.24 3 --18 324 0.8 0.64 4 -8 7.84 18 324 -5.04 -1.8 3.24 0.8 0.64 -1.44 324 42 0.64 -1.44 17.64 -12 e4 -5.04 0.64 -1.2 0.96 Page 1 of 5 1358 words English (United States Focus E + 94% O APR 28 . . . 4 hulu WWord File Edit View Insert Format Tools Table Window Help 44% D Sun 2:11 PM Q DE AutoSave . OFF HW8-042824 ~ Home Insert Draw Design Layout References Mailings Review View Table Design Layout ? Tell me Share Comments Calibri (BO.. * 11 A A Aa Ap AaBbCcDdEe AaBbCcDdEe AaBbCCD AaBbCcDdE AaBb hot Paste BI Ub x x A LA 38 PM EBEE IEv Normal No Spacing Heading 1 Heading 2 Title Styles Dictate Sensitivity Pane 12 2 J.44 -12 144 -1.44 3.24 -2 0.04 0.36 12 -1.8 3.24 0.8 0.64 -1.44 11 --2.8 7.84 0.64 -2.24 -1.81 3.24 08 0.64 -144 784 1.8 3.24 -5.04 -1.8 3.24 0.8 0.64 -1.44 -1.8 3.24 0.8 0.64 -1.44 17.64 -121 1.44 -5.04 0.64 0.96 14 0.2 0.04 -1.21 1.44 -0.24 15 12 -1.2 1.44 16 1.44 2.2 4.84 004 -44 EX=345 EY=55 2=0 E=230 2=0 2=42 =-80 Mean X = (IX / N) = 345/25=13.8 Mean y = (EY / N) = 55/25/2.2 Variance [X] - S'x = [ [X - X ]'/N-1=9.583 Standard deviation (X) = Sx = square root (3.096) = Variance [YL _ S'y = E [y- Y) / N-1 = 1.75 Standard deviation () = Sy = square root (1.323) = Covariance [X.Y) = Sxy = = [X- X" ] ()- X" )/ N-1=-3.333 "= SxX / Sx * Sy = -0.814 "Answers may differ slightly due to rounding 2. Calculate the least squares regression equation using education as a predictor variable. What is the value of the slope, b (5 pts)? What is the value of the intercept, a (3 pts)? What is the prediction equation (2 pts)? 3. What is the predicted number of children for a person with a college degree (16 years of education) (5 pts)? 4. Does any respondent actually have this number of children? If so, what is his or her level of education? If not, is this a problem or an indication that the regression equation you calculated is incorrect? Why or why not (5 pts)? Page 2 of 5 1358 words English (United States) Focus E + 94% APR O 28 hulu W
Step by Step Solution
There are 3 Steps involved in it

Get step-by-step solutions from verified subject matter experts