

Question: work analysis & design 1. (20 pts) The following table shows signal and noise distribution parameters (in nm) for two operators. State Operator 1 Standard
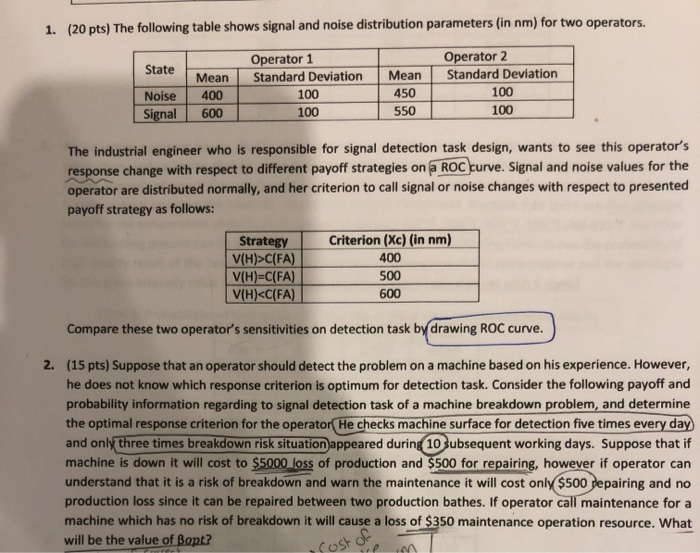
1. (20 pts) The following table shows signal and noise distribution parameters (in nm) for two operators. State Operator 1 Standard Deviation 100 100 Mean 400 600 Noise Signal Operator 2 Standard Deviation 100 100 Mean 450 550 The industrial engineer who is responsible for signal detection task design, wants to see this operator's response change with respect to different payoff strategies on a ROC curve. Signal and noise values for the operator are distributed normally, and her criterion to call signal or noise changes with respect to presented payoff strategy as follows: Strategy V(H)>C(FA) V(H)=C(FA) V(H)
Step by Step Solution
There are 3 Steps involved in it

Get step-by-step solutions from verified subject matter experts