

Question: Work on the following problem set from chapter 11 1. Using the data below, test the research hypothesis at the 05 level of significance that
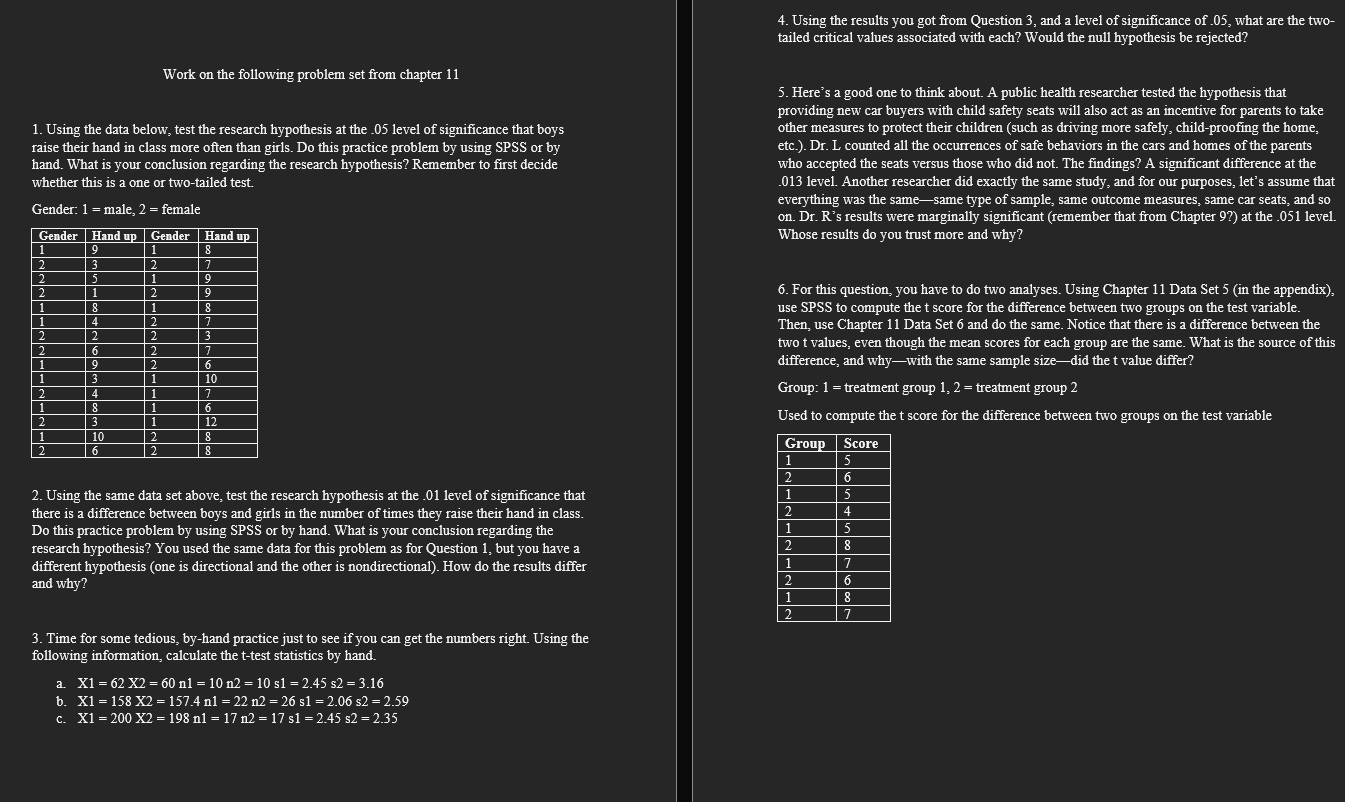
Work on the following problem set from chapter 11 1. Using the data below, test the research hypothesis at the 05 level of significance that boys raise their hand in class more often than girls. Do this practice problem by using SPSS or by hand. What 1s your conclusion regarding the research hypothesis? Remember to first decide whether this is a one or two-tailed test. Gender: 1 = male, 2 = female 2. Using the same data set above, test the research hypothesis at the .01 level of significance that there is a difference between boys and girls in the number of times they raise their hand in class. Do this practice problem by using SPSS or by hand. What is your conclusion regarding the bttt fe (e ou used the same data for this problem as for Question 1, but you have a different hypothesis (one is directional and the other is nondirectional). How do the results differ BT R 3. Time for some tedious, by-hand practice just to see if you can get the numbers right. Using the following information, calculate the t-test statistics by hand. a X1=62X2=60n1=10n2=10s1 KRl b, X1=158X2=1574n1=22n2 X1=200X2=198n1 =17 n2 4. Using the results you got from Question 3, and a level of significance of .05, what are the two- tailed critical values associated with each? Would the null hypothesis be rejected? 5. Here's a good one to think about. A public health researcher tested the hypothesis that providing new car buyers with child safety seats will also act as an incentive for parents to take other measures to protect their children (such as driving more safely, child-proofing the home, etc.). Dr. L counted all the occurrences of safe behaviors in the cars and homes of the parents who accepted the seats versus those who did not. The findings? A significant difference at the {013 level Another researcher did exactly the same study. and for our purposes, let's assume that everything was the samesame type of sample, same outcome measures, same car seats, and so on. Dr. Rs results were marginally significant (remember that from Chapter 97) at the .051 level. Whose results do you trust more and why? 6. Far this question, you have to do two analyses. Using Chapter 11 Data Set 5 (in the appendix). use SPSS to compute the t score for the difference between two groups on the test variable. Then, use Chapter 11 Data Set 6 and do the same. Notice that there is a difference between the two t values, even though the mean scores for each group are the same. What 15 the source of this difference, and whywith the same sample sizedid the t value differ? Group: 1 = treatment group 1, 2 = treatment group 2 Used to compute the t score for the difference between two groups on the test variable
Step by Step Solution
There are 3 Steps involved in it

Get step-by-step solutions from verified subject matter experts