Question: Work through the slide deck entitled GCI Group Report Actions . Pay particular attention to the aggregated results for our whole class. Think about your
Work through the slide deck entitled GCI Group Report
Actions
. Pay particular attention to the aggregated results for our whole class.
Think about your cohort here as your organizational team.
If these are your organization's results, what would you identify as your collective strengths? What areas would you prioritize for improvement? What learning experiences would you design to impact these areas in a positive way?
In short, what would be your strategy for leveraging your team in the global business environment?
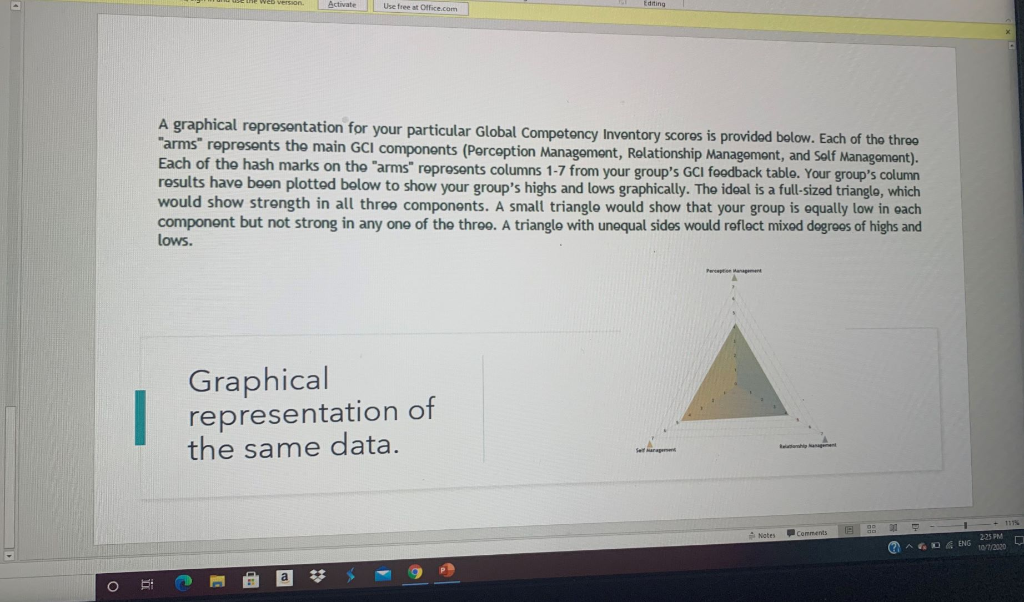
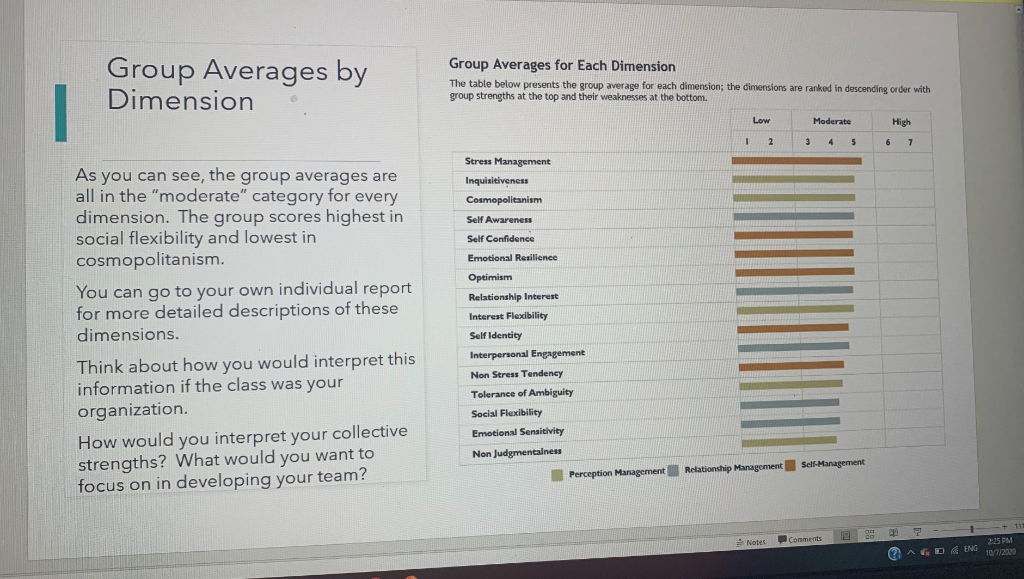

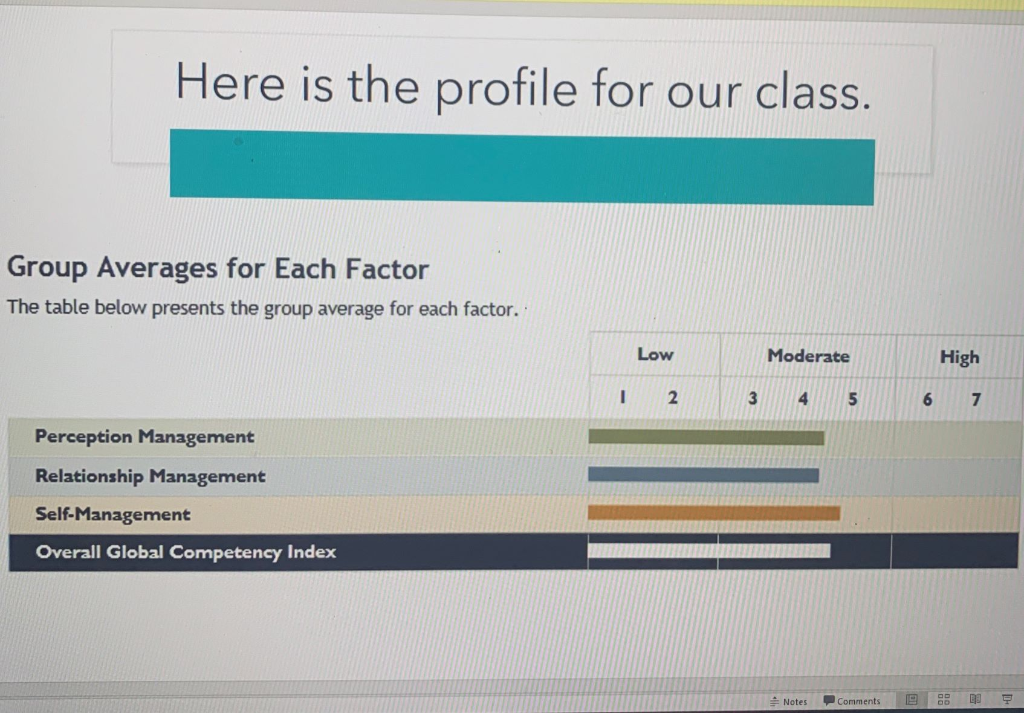
version Activate Use tree at Office.com A graphical representation for your particular Global Competency Inventory scores is provided below. Each of the throe "arms" represents the main GCI components (Perception Management, Relationship Management, and Self Management). Each of the hash marks on the "arms" represents columns 1-7 from your group's GCI foodback table. Your group's column results have been plotted below to show your group's highs and lows graphically. The ideal is a full-sized triangle, which would show strength in all three components. A small triangle would show that your group is equally low in each component but not strong in any one of the three. A triangle with unequal sides would reflect mixed degrees of highs and lows. Graphical representation of the same data. SD Notes Comments 2:25 PM AGO 6 ENG 107/2020 P O BI Group Averages by Dimension Group Averages for Each Dimension The table below presents the group average for each dimension; the dimensions are ranked in descending order with group strengths at the top and their weaknesses at the bottom. Low Moderate High 6 7 As you can see, the group averages are all in the "moderate" category for every dimension. The group scores highest in social flexibility and lowest in cosmopolitanism. You can go to your own individual report for more detailed descriptions of these dimensions. Think about how you would interpret this information if the class was your organization. How would you interpret your collective strengths? What would you want to focus on in developing your team? 2. 3 4 5 Stress Management Inquisitiveness Cosmopolitanism Self Awareness Self Confidence Emotional Resilience Optimism Relationship Interest Interest Flexibility Self Identity Interpersonal Engagement Non Stress Tendency Tolerance of Ambiguity Social Flexibility Emotional Sensitivity Non Judgmentalness Perception Management Relationship Management Self-Management Comments Notes (? AGOK ENG225 PM 10/7/2003 version Activate Use tree at Office.com A graphical representation for your particular Global Competency Inventory scores is provided below. Each of the throe "arms" represents the main GCI components (Perception Management, Relationship Management, and Self Management). Each of the hash marks on the "arms" represents columns 1-7 from your group's GCI foodback table. Your group's column results have been plotted below to show your group's highs and lows graphically. The ideal is a full-sized triangle, which would show strength in all three components. A small triangle would show that your group is equally low in each component but not strong in any one of the three. A triangle with unequal sides would reflect mixed degrees of highs and lows. Graphical representation of the same data. SD Notes Comments 2:25 PM AGO 6 ENG 107/2020 P O BI Here is the profile for our class. Group Averages for Each Factor The table below presents the group average for each factor. Low Moderate High 1 2 3 4 5 6 7 Perception Management Relationship Management Self-Management Overall Global Competency Index Notes Comments RE version Activate Use tree at Office.com A graphical representation for your particular Global Competency Inventory scores is provided below. Each of the throe "arms" represents the main GCI components (Perception Management, Relationship Management, and Self Management). Each of the hash marks on the "arms" represents columns 1-7 from your group's GCI foodback table. Your group's column results have been plotted below to show your group's highs and lows graphically. The ideal is a full-sized triangle, which would show strength in all three components. A small triangle would show that your group is equally low in each component but not strong in any one of the three. A triangle with unequal sides would reflect mixed degrees of highs and lows. Graphical representation of the same data. SD Notes Comments 2:25 PM AGO 6 ENG 107/2020 P O BI Group Averages by Dimension Group Averages for Each Dimension The table below presents the group average for each dimension; the dimensions are ranked in descending order with group strengths at the top and their weaknesses at the bottom. Low Moderate High 6 7 As you can see, the group averages are all in the "moderate" category for every dimension. The group scores highest in social flexibility and lowest in cosmopolitanism. You can go to your own individual report for more detailed descriptions of these dimensions. Think about how you would interpret this information if the class was your organization. How would you interpret your collective strengths? What would you want to focus on in developing your team? 2. 3 4 5 Stress Management Inquisitiveness Cosmopolitanism Self Awareness Self Confidence Emotional Resilience Optimism Relationship Interest Interest Flexibility Self Identity Interpersonal Engagement Non Stress Tendency Tolerance of Ambiguity Social Flexibility Emotional Sensitivity Non Judgmentalness Perception Management Relationship Management Self-Management Comments Notes (? AGOK ENG225 PM 10/7/2003 version Activate Use tree at Office.com A graphical representation for your particular Global Competency Inventory scores is provided below. Each of the throe "arms" represents the main GCI components (Perception Management, Relationship Management, and Self Management). Each of the hash marks on the "arms" represents columns 1-7 from your group's GCI foodback table. Your group's column results have been plotted below to show your group's highs and lows graphically. The ideal is a full-sized triangle, which would show strength in all three components. A small triangle would show that your group is equally low in each component but not strong in any one of the three. A triangle with unequal sides would reflect mixed degrees of highs and lows. Graphical representation of the same data. SD Notes Comments 2:25 PM AGO 6 ENG 107/2020 P O BI Here is the profile for our class. Group Averages for Each Factor The table below presents the group average for each factor. Low Moderate High 1 2 3 4 5 6 7 Perception Management Relationship Management Self-Management Overall Global Competency Index Notes Comments RE


