

Question: work you have completed so far. It does not 5 Your Graph Score: 85% Market for Wheat 5.5 T 5.0 Supply Demand 4.5 Eq Price
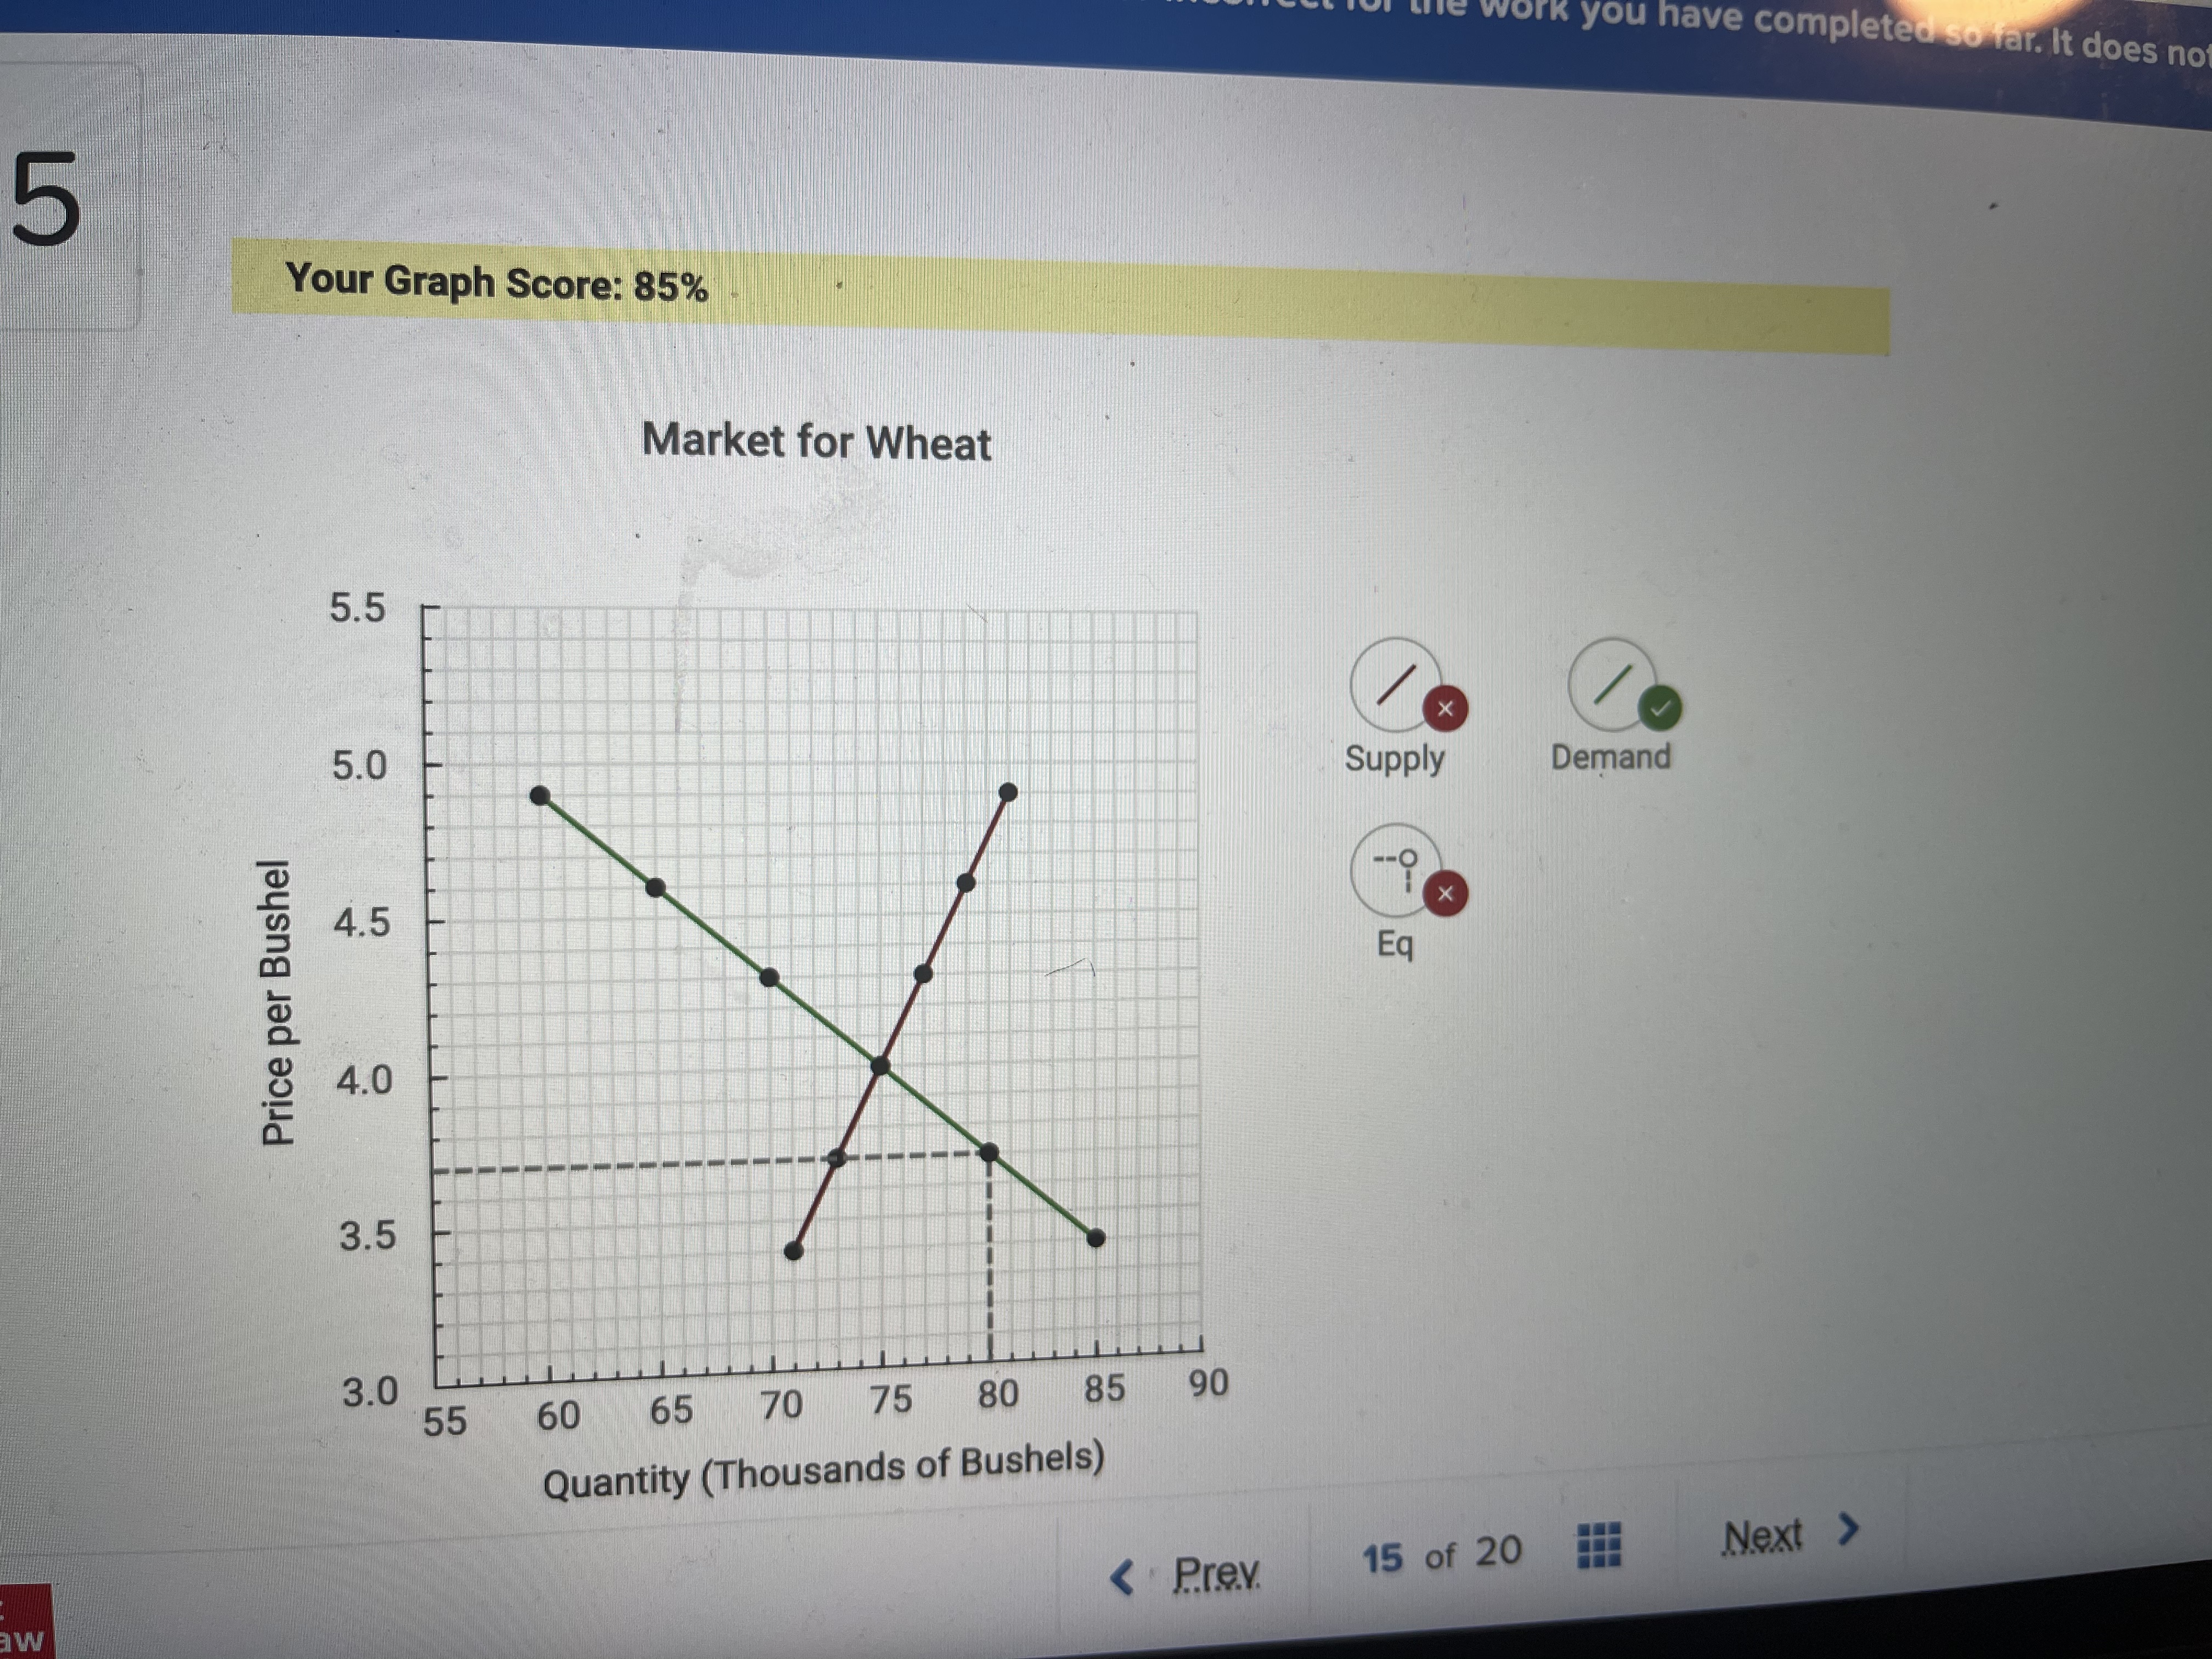
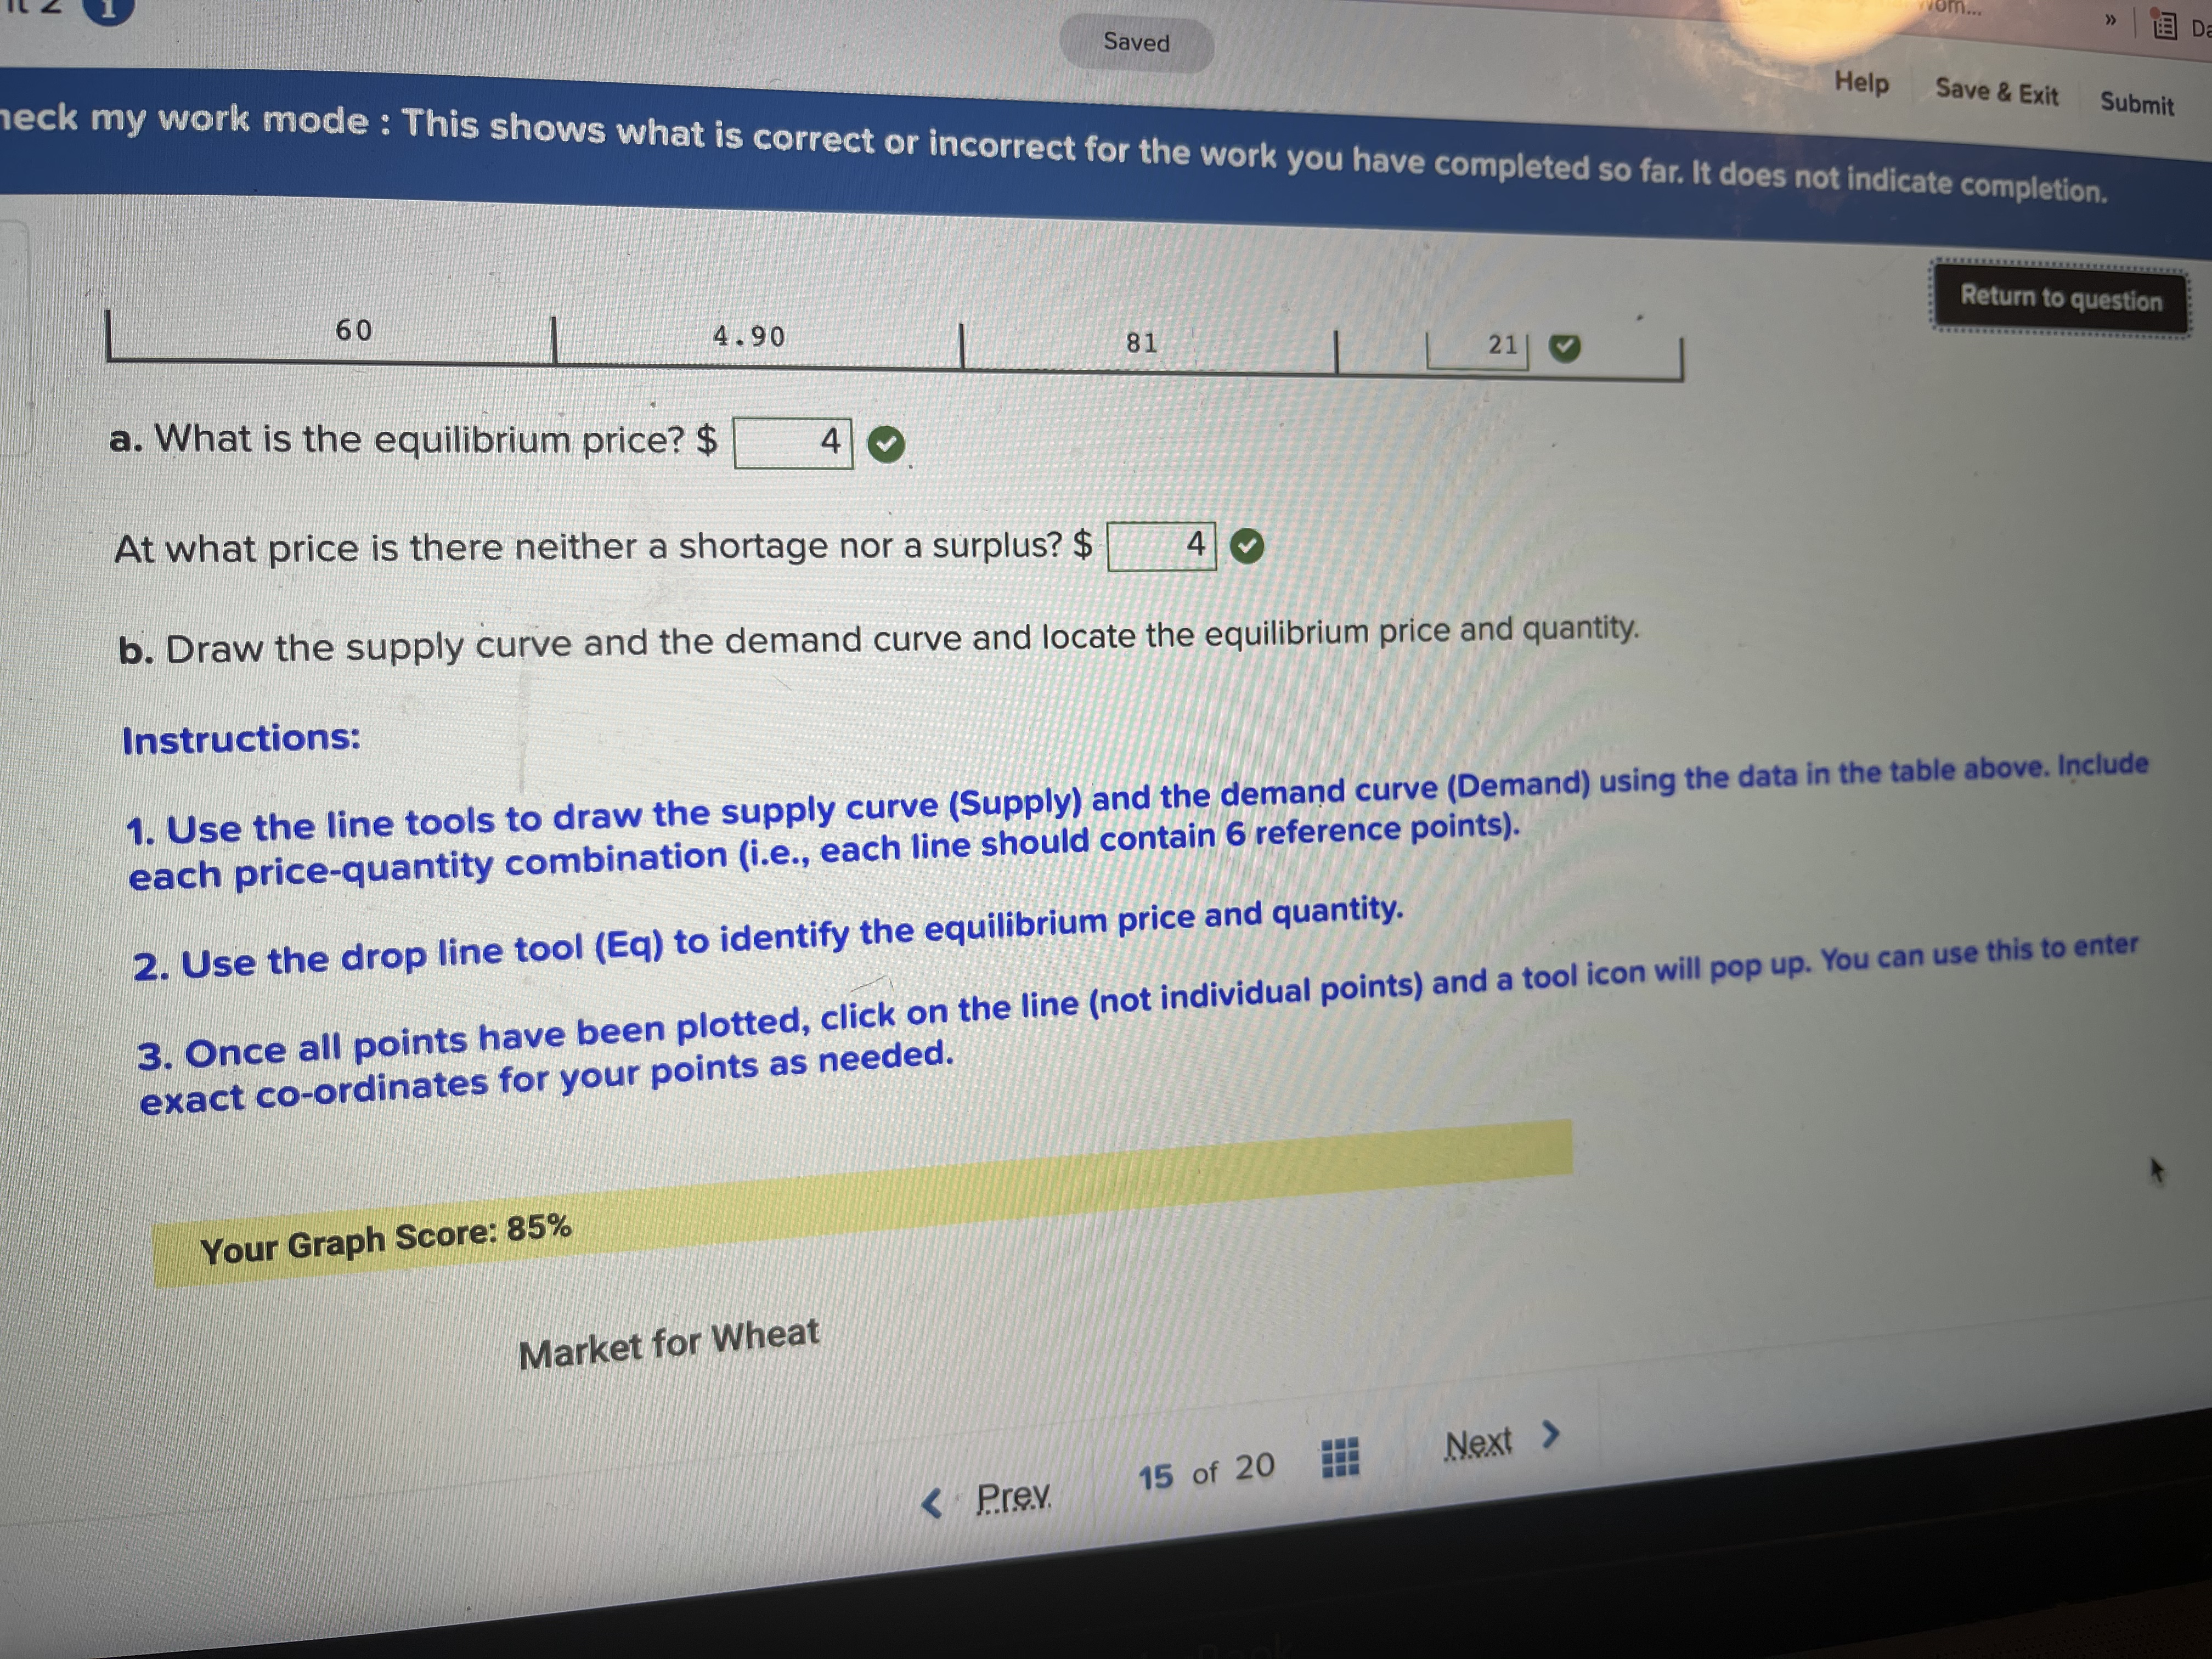
work you have completed so far. It does not 5 Your Graph Score: 85% Market for Wheat 5.5 T 5.0 Supply Demand 4.5 Eq Price per Bushel 4.0 3.5 3.0 60 65 70 75 80 85 90 55 Quantity (Thousands of Bushels) Saved Help Save & Exit Submit neck my work mode : This shows what is correct or incorrect for the work you have completed so far. It does not indicate completion. 60 Return to question 4 . 90 81 21| a. What is the equilibrium price? $ 4 0 At what price is there neither a shortage nor a surplus? $ 4 b. Draw the supply curve and the demand curve and locate the equilibrium price and quantity. Instructions: 1. Use the line tools to draw the supply curve (Supply) and the demand curve (Demand) using the data in the table above. Include each price-quantity combination (i.e., each line should contain 6 reference points). 2. Use the drop line tool (Eq) to identify the equilibrium price and quantity. 3. Once all points have been plotted, click on the line (not individual points) and a tool icon will pop up. You can use this to enter exact co-ordinates for your points as needed. Your Graph Score: 85% Market for Wheat Next > 15 of 20
Step by Step Solution
There are 3 Steps involved in it

Get step-by-step solutions from verified subject matter experts