

Question: Workbook Questions #10 - #12 Part c. August Variance Analysis During September of the current year, Robin was asked to perform variance analyses for August.


Workbook Questions #10 - #12
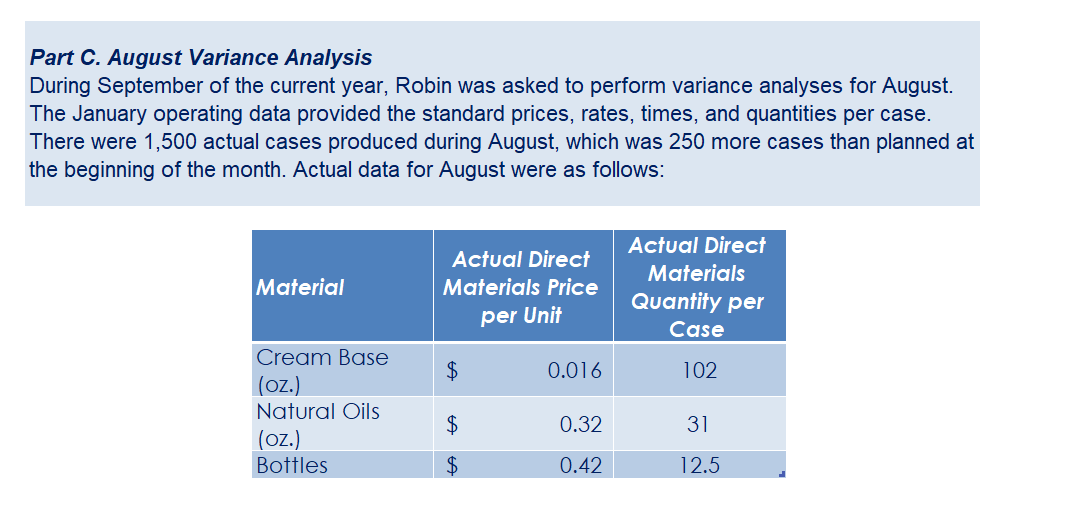
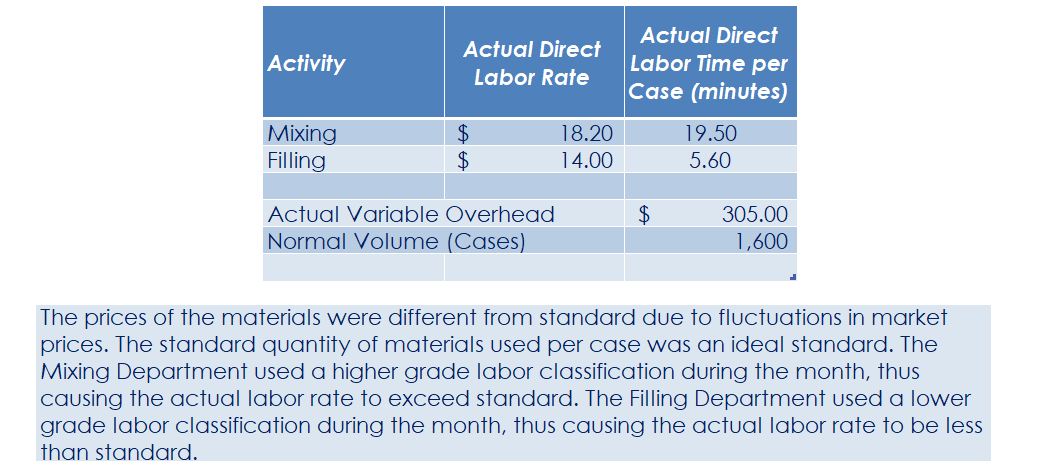
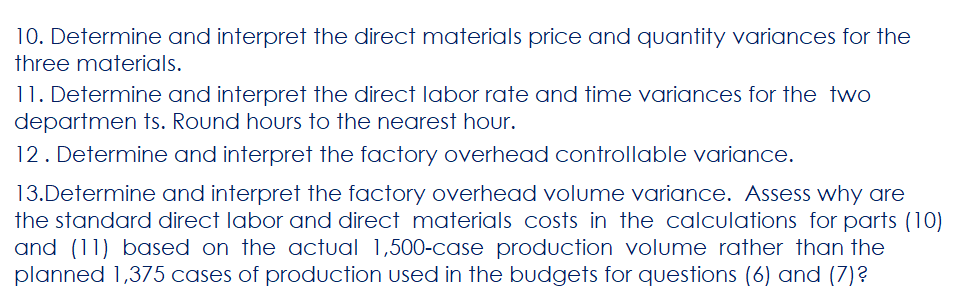
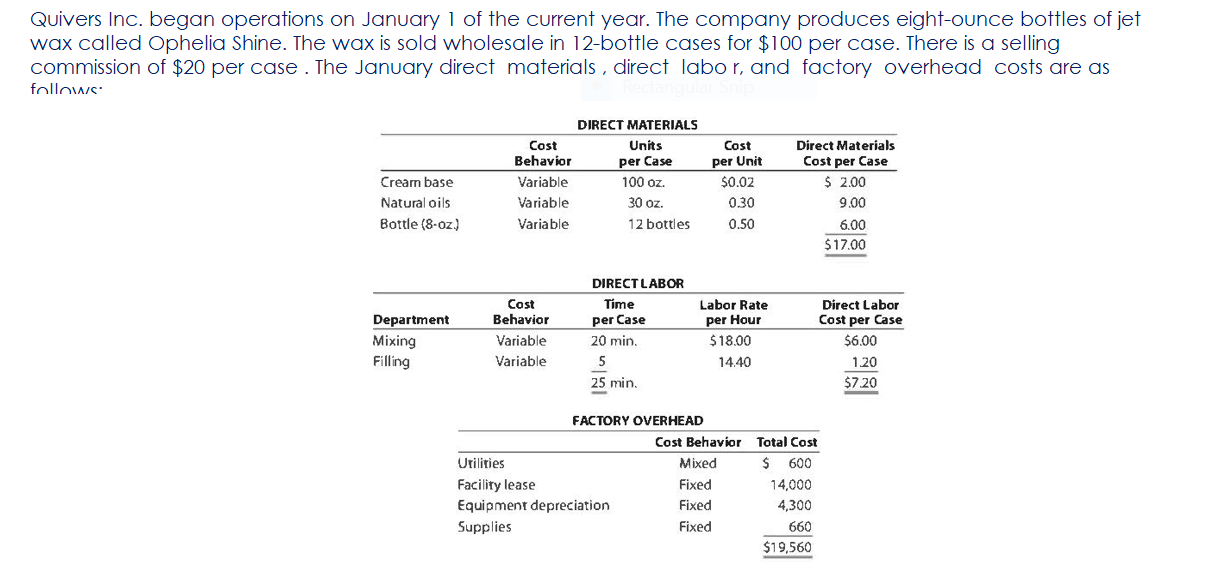
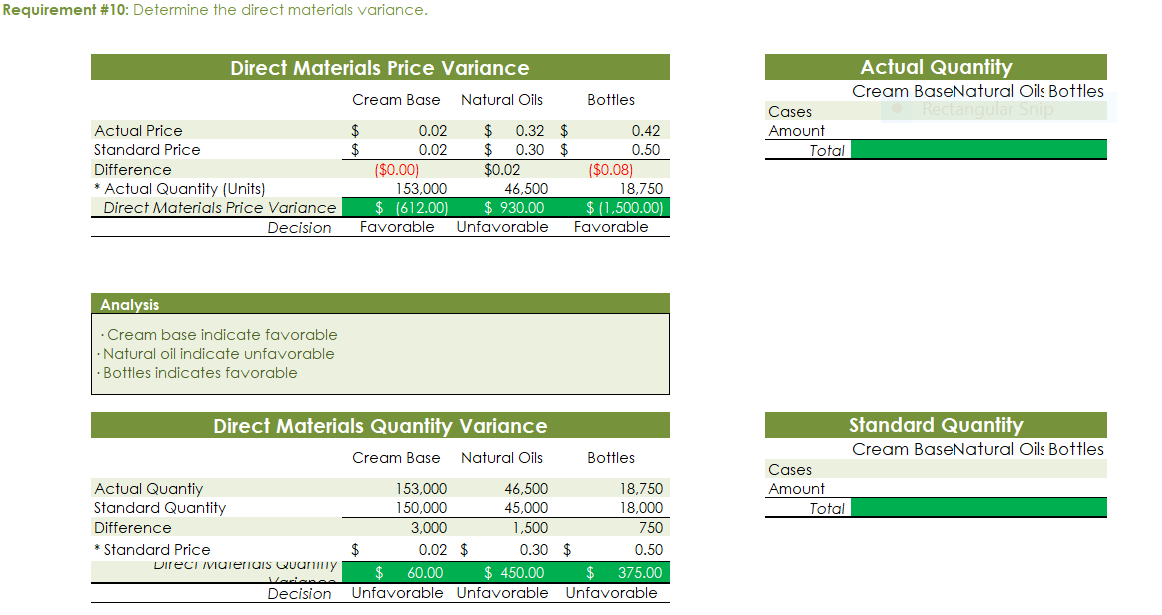
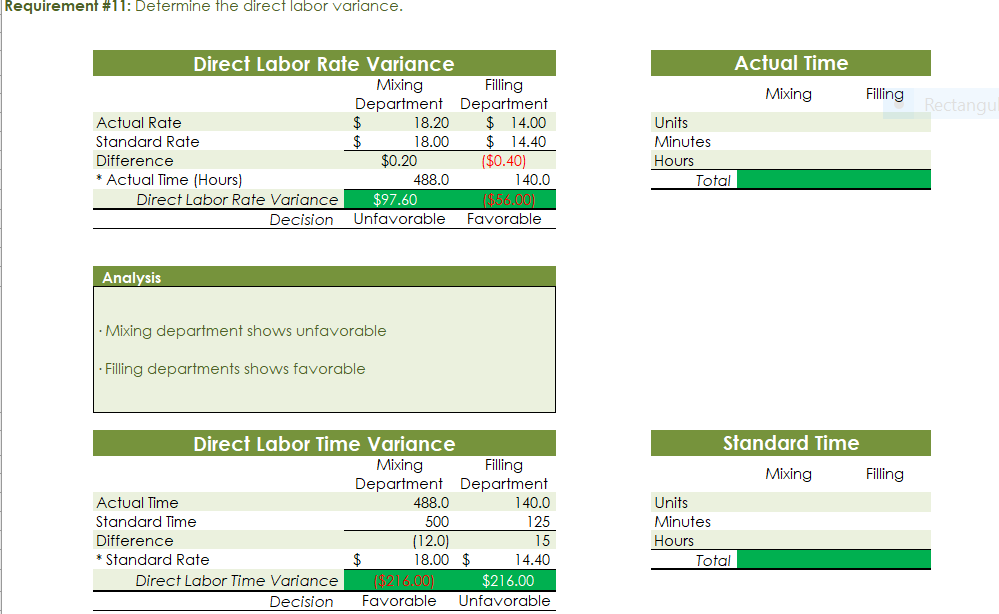

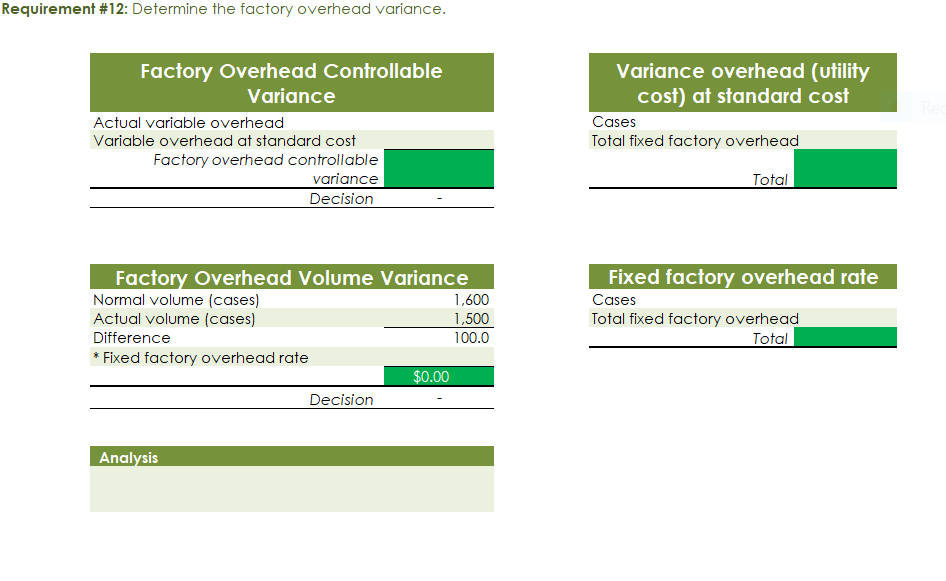
Part c. August Variance Analysis During September of the current year, Robin was asked to perform variance analyses for August. The January operating data provided the standard prices, rates, times, and quantities per case. There were 1,500 actual cases produced during August, which was 250 more cases than planned at the beginning of the month. Actual data for August were as follows: Actuai Direct Actuai Direct Materiai Materiais Price Matenais er Unit Quantity per p Case Natural Oils (OZ) Actual Direct Actual Direct Actlwty Labor Rate Labor Time per Case (minutes) Filling s T 4.00 5.60 Actual Variable Overhead $ 305.00 The prices of the materials were different from standard due to fluctuations in market prices. The standard quantity of materials used per case was an ideal standard. The Mixing Department used a higher grade labor classification during the month, thus causing the actual labor rate to exceed standard. The Filling Department used a lower grade labor classification during the month, thus causing the actual labor rate to be less than standard. lO. Determine and interpret the direct materials price and quantity variances for the three materials. 1 l . Determine and interpret the direct labor rate and time variances for the two departmen ts. Round hours to the nearest hour. 12 . Determine and interpret the factory overhead controllable variance. 13.Determine and interpret the factory overhead volume variance. Assess why are the standard direct labor and direct materials costs in the calculations for parts (10] and (ill based on the actual l,500case production volume rather than the planned 1,375 cases of production used in the budgets for questions (6] and (7]? \fRequirement #12: Determine the factory overhead variance. Factory Overhead Controllable Variance overhead (utility Variance cost) at standard cost Actual variable overhead Cases Variable overhead at standard cost Total xed factoryI overhead Factory overhead controllable variance Total Decision - Facto Overhead Volume Variance Fixed factory overhead rate Normal volume {cases} 1.600 Cases Actual volume {cases} 1.500 Total xed factoryr overhead Difference 100.0 Total ' Fixed factoryr overhead rate m Decision - Anal sis
Step by Step Solution
There are 3 Steps involved in it

Get step-by-step solutions from verified subject matter experts