

Question: Worker Worker K L M A B D E F Test Score 55 38 93 86 88 66 47 50 41 69 Production Rating 40
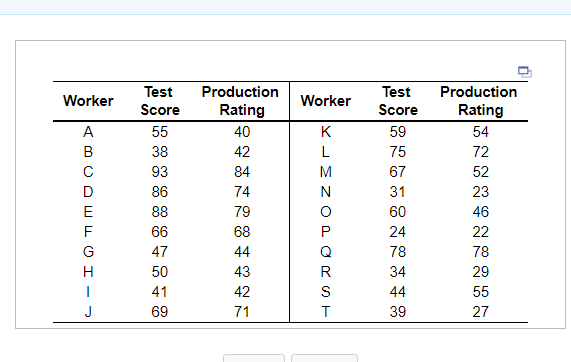
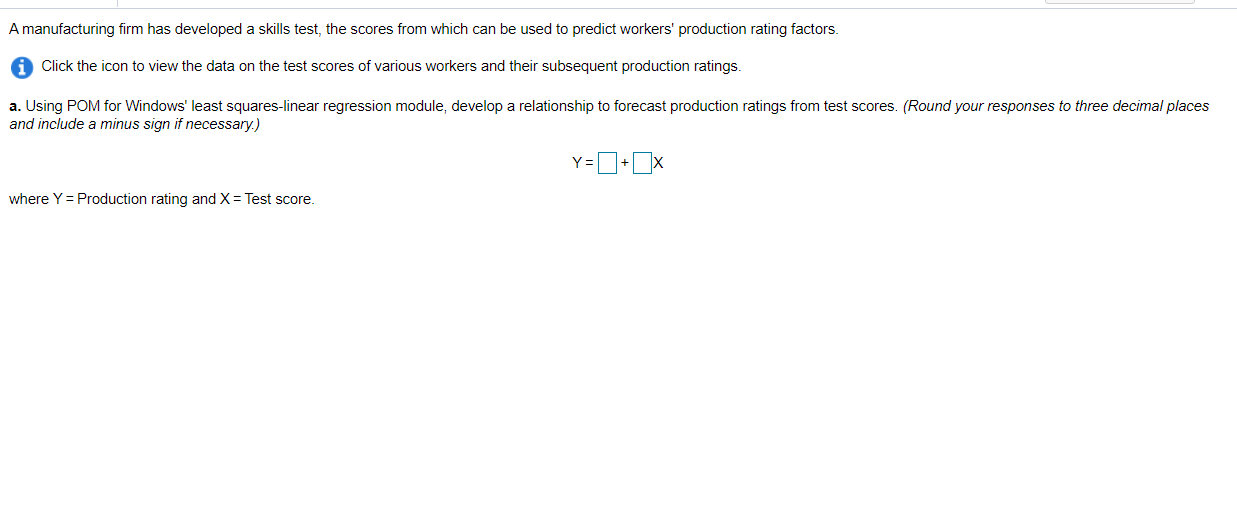
Worker Worker K L M A B D E F Test Score 55 38 93 86 88 66 47 50 41 69 Production Rating 40 42 84 74 79 68 44 43 42 71 Test Score 59 75 67 31 60 24 78 34 44 39 Production Rating 54 72 52 23 46 22 78 29 55 27 O. Or R S T J Amanufacturing firm has developed a skills test, the scores from which can be used to predict workers' production rating factors. Click the icon to view the data on the test scores of various workers and their subsequent production ratings a. Using POM for Windows' least squares-linear regression module, develop a relationship to forecast production ratings from test scores. (Round your responses to three decimal places and include a minus sign if necessary.) Y=0+ x where Y = Production rating and X = Test score
Step by Step Solution
There are 3 Steps involved in it
1 Expert Approved Answer
Step: 1 Unlock

Question Has Been Solved by an Expert!
Get step-by-step solutions from verified subject matter experts
Step: 2 Unlock
Step: 3 Unlock