

Question: Working matlab code and explanation. Thanks Consider the signal x(t): x(t) = e^-|t| Ideal sampling is applied to this signal. The sampling frequency is 2.6
 Working matlab code and explanation. Thanks
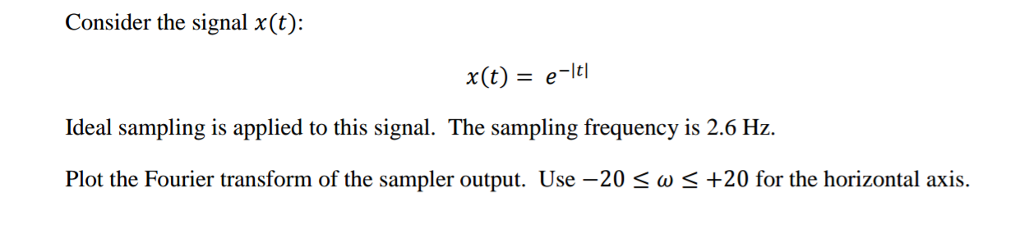
Consider the signal x(t): x(t) = e^-|t| Ideal sampling is applied to this signal. The sampling frequency is 2.6 Hz. Plot the Fourier transform of the sampler output. Use -20 lessthanorequalto omega lessthanorequalto + 20 for the horizontal axis
Step by Step Solution
There are 3 Steps involved in it
1 Expert Approved Answer
Step: 1 Unlock

Question Has Been Solved by an Expert!
Get step-by-step solutions from verified subject matter experts
Step: 2 Unlock
Step: 3 Unlock