

Question: working out and explanations on how to do it would be great. If you click the file the picture should show up clearer An agency
working out and explanations on how to do it would be great. If you click the file the picture should show up clearer
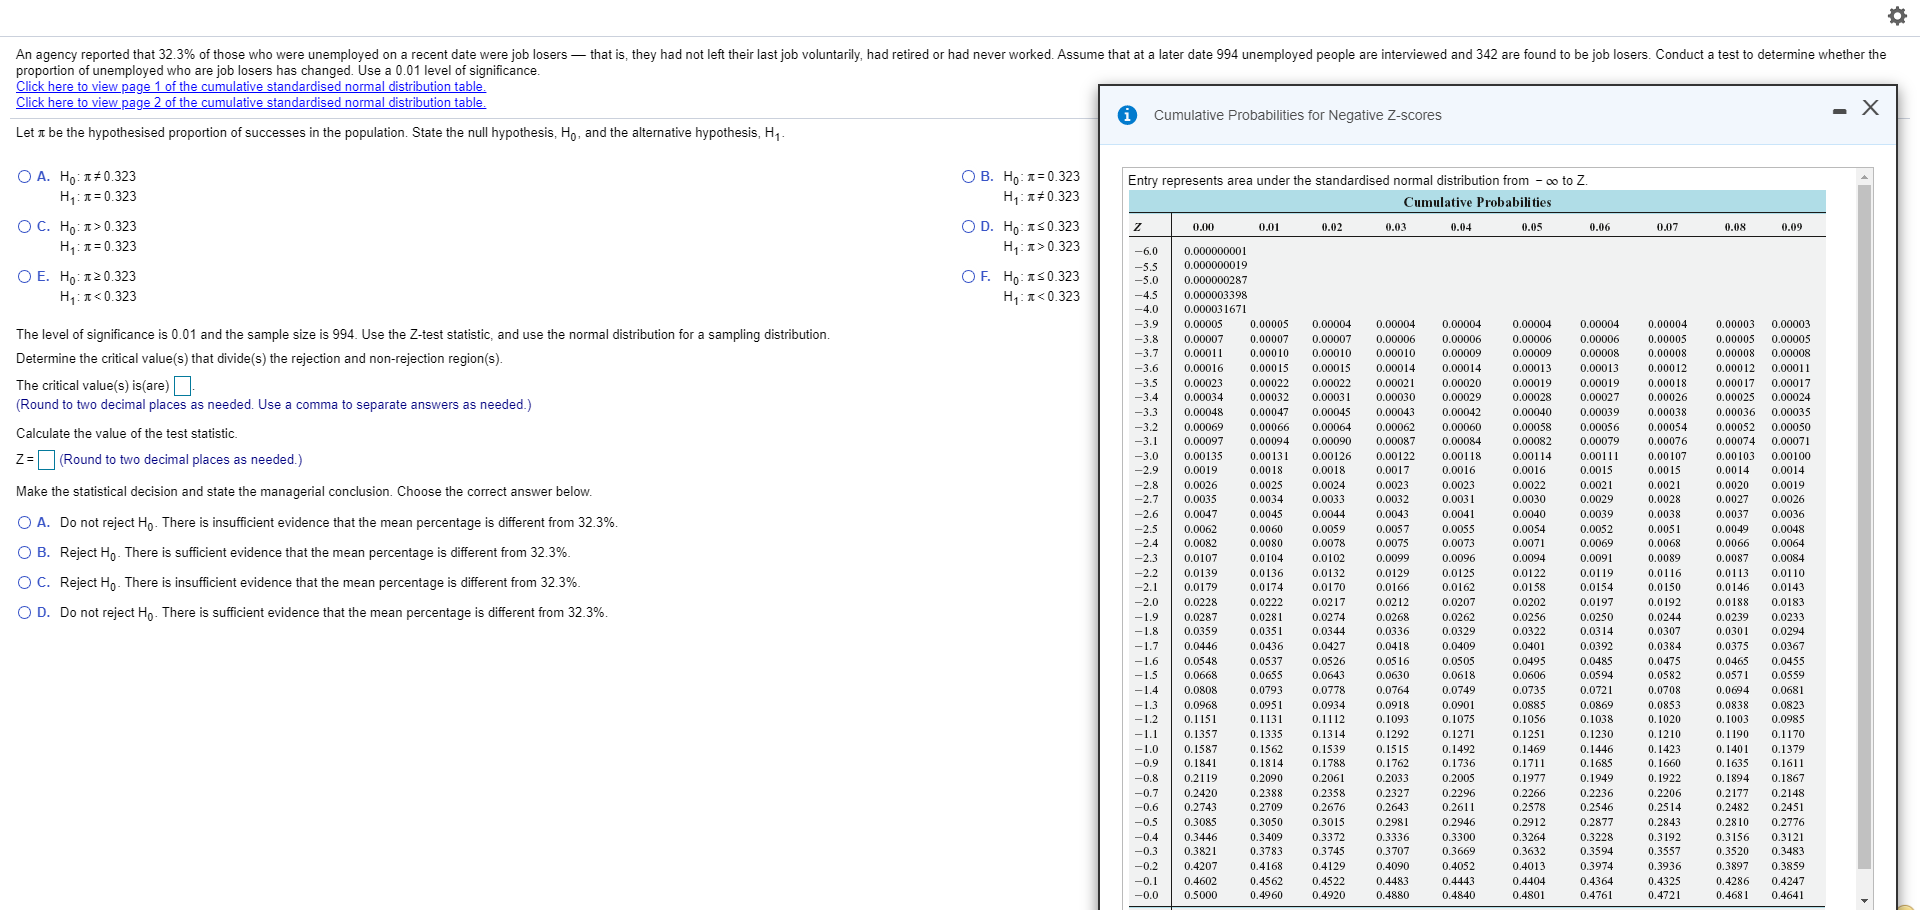
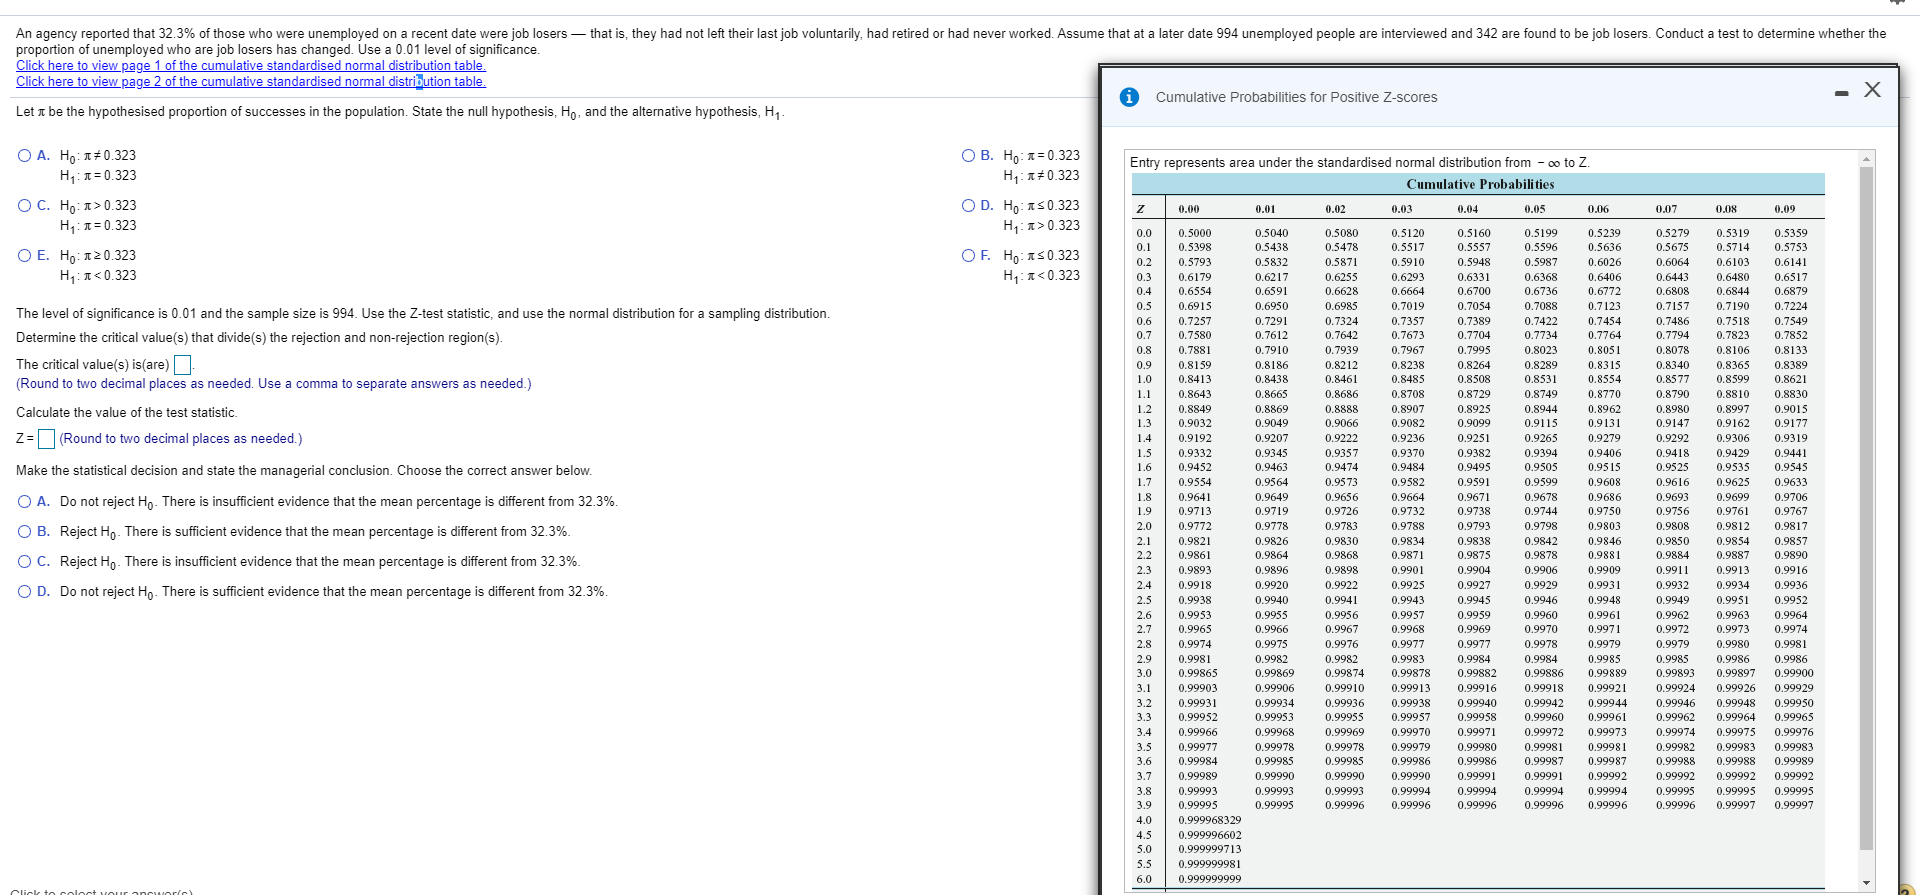
An agency reported that 32.3% of those who were unemployed on a recent date were job losers - that is, they had not left their last job voluntarily, had retired or had never worked. Assume that at a later date 994 unemployed people are interviewed and 342 are found to be job losers. Conduct a test to determine whether the proportion of unemployed who are job losers has changed. Use a 0.01 level of significance. Click here to view page 1 of the cumulative standardised normal distribution table. Click here to view page 2 of the cumulative standardised normal distribution table. Let it be the hypothesised proportion of successes in the population. State the null hypothesis, Ho, and the alternative hypothesis, H,- Cumulative Probabilities for Negative Z-scores O A. Ho: It # 0.323 H1 : It= 0.323 O B. Ho: 1= 0.323 Entry represents area under the standardised normal distribution from - co to Z. O C. Ho: It > 0.323 H1: It # 0.323 Cumulative Probabilities H1: It= 0.323 O D. HO: IS0.323 0.00 0.01 0.02 0.03 0.04 0.06 0.07 0.08 0.09 O E. Ho: It 2 0.323 -6.0 0.000000001 H1: It 0.323 Cumulative Probabilities H1: 1= 0.323 OD. Ho: AS 0.323 0.00 0.01 0.02 0.03 H1: 1 > 0.323 0.06 0.07 0.08 0.09 O E. Ho: 1 2 0.323 0.1 0.5398 .5239 OF. HO: MS0.323 0.5438 0.5478 0.5517 0.5557 0.5596 0.2 0.5832 0.5636 0.5675 0.5753 H1: *
Step by Step Solution
There are 3 Steps involved in it

Get step-by-step solutions from verified subject matter experts