

Question: Worksheet Data collection: Toss Days # patient remaining: 0 O 100 1 7 2 14 3 21 4 28 5 35 6 42 7 49
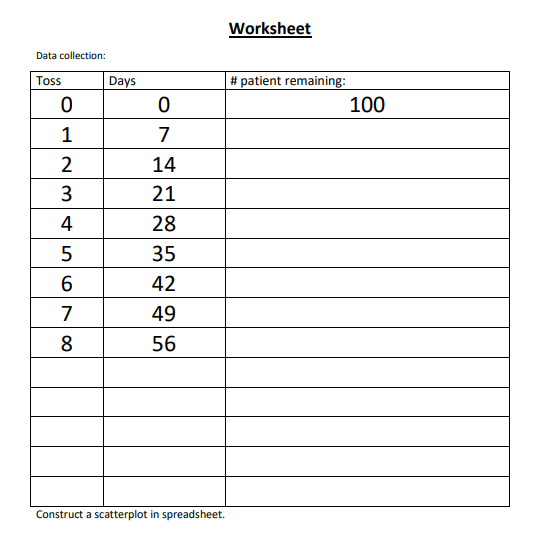
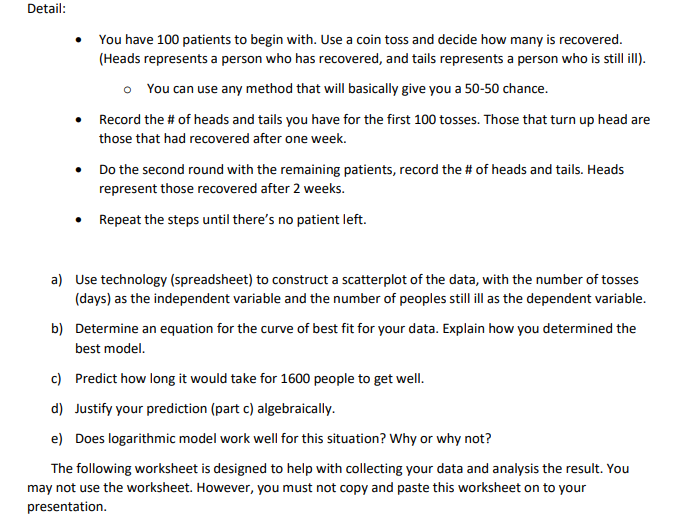
Worksheet Data collection: Toss Days # patient remaining: 0 O 100 1 7 2 14 3 21 4 28 5 35 6 42 7 49 8 56 Construct a scatterplot in spreadsheet.Detail: - You have me patients to begin with. Use a coin toss and decide how many is recovered. [Heads represents a person who has recovered, and tails represents a person who is still ill]. 0 You can use any method that will basically give you a 5050 chance. I Record the tr of heads and tails you have for the rst we tosses. Those that turn up head are those that had recovered after one week. . Do the second round with the remaining patients. record the if of heads and tails. Heads represent those recovered after 2 weeks. I Repeat the steps until there's no patient left. a] Use technology {spreadsheet} to construct a scatterplot of the data with the number of tosses {days} as the independent variable and the number of peoples still ill as the dependent variable. b} Determine an equation for the curve of best fit for your data. Explain how you determined the best model. c] Predict how long it would talce for 1500 people to get well. d} Justify your prediction {part c] algebraically. e] Does logarithmic model work well for this situation? Why or why not? The following worksheet is designed to help with collecting your data and analysis the result. You may not use the worksheet. However. you must not copy and paste this worksheet on to your presentatio n
Step by Step Solution
There are 3 Steps involved in it

Get step-by-step solutions from verified subject matter experts