

Question: Worksheet: https://github.com/zagorad/donors2008/blob/main/avg_rain_state.csv Download avg_rain_state.csv. Open and read the file the CSV file into a pandas DataFrame, called df. Using the MATLAB matplotlib method, complete the
Worksheet:
https://github.com/zagorad/donors2008/blob/main/avg_rain_state.csv
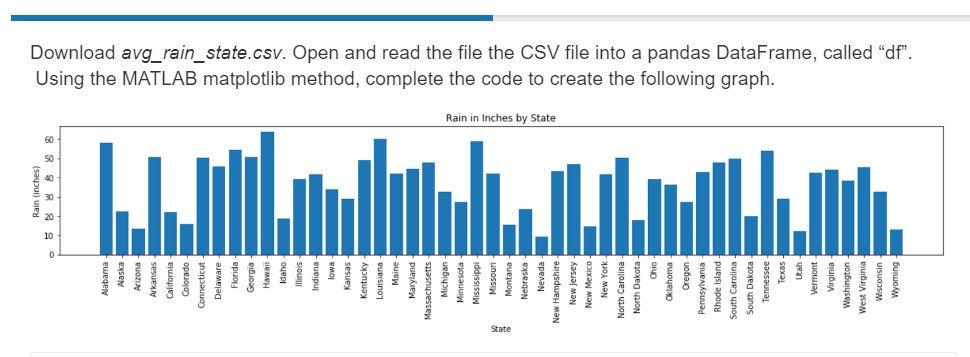
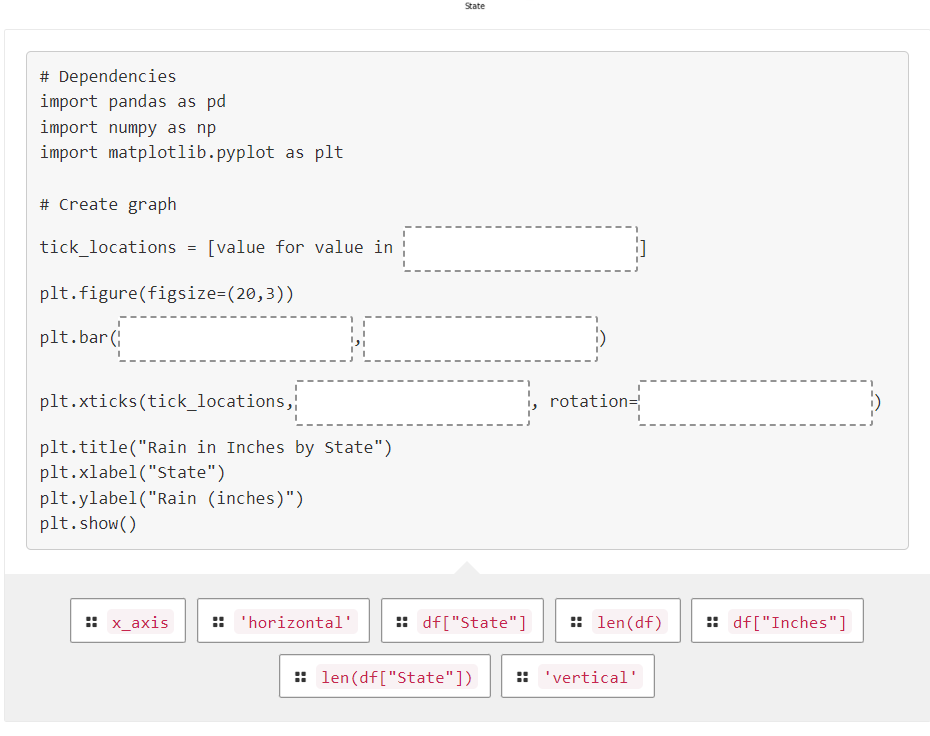
Download avg_rain_state.csv. Open and read the file the CSV file into a pandas DataFrame, called "df". Using the MATLAB matplotlib method, complete the code to create the following graph. \# Dependencies import pandas as pd import numpy as np import matplotlib.pyplot as plt \# Create graph tick_locations = [value for value in plt.figure(figsize=(20,3)) plt.bar( plt.xticks(tick_locations, plt.title("Rain in Inches by State") plt.xlabel("State") plt.ylabel("Rain (inches)") plt.show()
Step by Step Solution
There are 3 Steps involved in it
1 Expert Approved Answer
Step: 1 Unlock

Question Has Been Solved by an Expert!
Get step-by-step solutions from verified subject matter experts
Step: 2 Unlock
Step: 3 Unlock