

Question: Workshop C-Directions: Construct a frequency table and histogram. The data below is from the Unit 1 test in Algebra I last year. Construct a
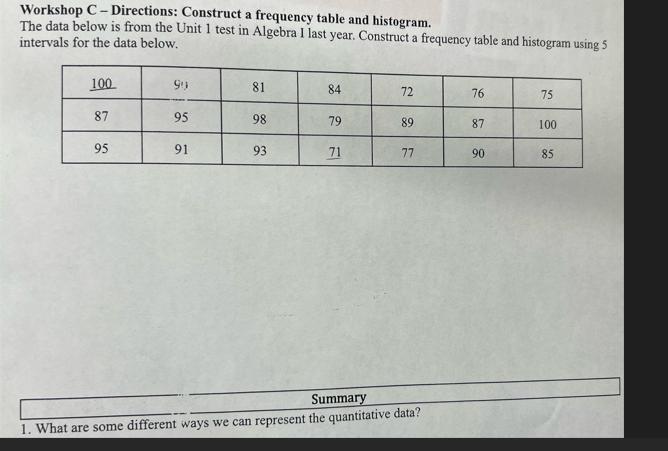
Workshop C-Directions: Construct a frequency table and histogram. The data below is from the Unit 1 test in Algebra I last year. Construct a frequency table and histogram using 5 intervals for the data below. 100 99 81 84 72 76 75 87 95 98 79 89 87 100 95 91 93 71 77 90 85 Summary 1. What are some different ways we can represent the quantitative data?
Step by Step Solution
There are 3 Steps involved in it
1 Expert Approved Answer
Step: 1 Unlock

Question Has Been Solved by an Expert!
Get step-by-step solutions from verified subject matter experts
Step: 2 Unlock
Step: 3 Unlock