

Question: Would a technical analyst Following are figures representing the number of stocks making new highs and new lows for each month over a six-month period:
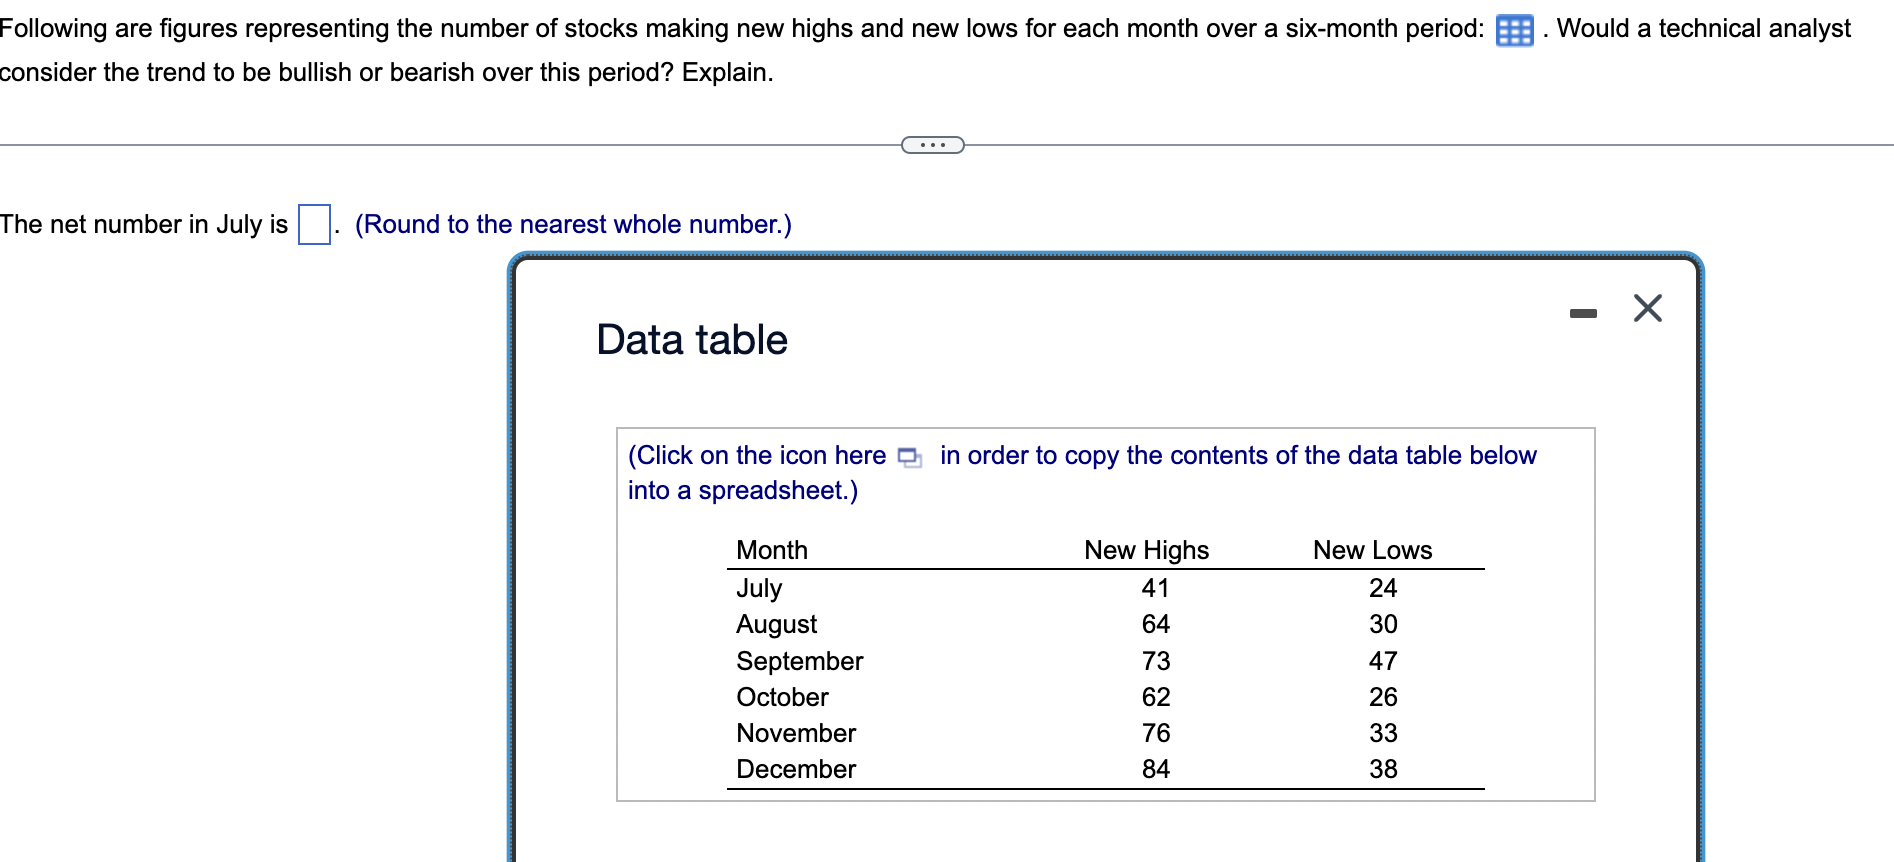
Would a technical analyst Following are figures representing the number of stocks making new highs and new lows for each month over a six-month period: consider the trend to be bullish or bearish over this period? Explain. The net number in July is (Round to the nearest whole number.) Data table in order to copy the contents of the data table below (Click on the icon here into a spreadsheet.) New Highs 41 Month July August September October November December 64 73 62 76 84 New Lows 24 30 47 26 33 38
Step by Step Solution
There are 3 Steps involved in it
1 Expert Approved Answer
Step: 1 Unlock

Question Has Been Solved by an Expert!
Get step-by-step solutions from verified subject matter experts
Step: 2 Unlock
Step: 3 Unlock