

Question: Would like Step by Step solutions for below question A police department's administration is interested in understanding the citizens in her city. The department randomly
Would like Step by Step solutions for below question
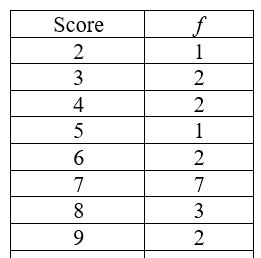
A police department's administration is interested in understanding the citizens in her city. The department randomly surveys 20 citizens and asks them to rate how satisfied they are on a scale of 1-9, where 1 is extremely dissatisfied 9 is extremely satisfied. Here is a simple frequency table of the collected data:
Solve for:
a.Calculate the mode.
b.Calculate the median.
c.Calculate the mean.
d.Is the mean a good measure of central tendency for these data? Why or why not? If you think it is not a good measure, what measure of central tendency would you use, and why?
e.Calculate the range.
f.Calculate the variance.
g.Calculate the standard deviation.
h.Which of them is the least accurate measure of variability?
Step by Step Solution
There are 3 Steps involved in it

Get step-by-step solutions from verified subject matter experts