

Question: would need help with this question: PLEASE put in excel form on plotting the graph And write equation when its ONLY A STRAIGHT LINE. Also
would need help with this question: 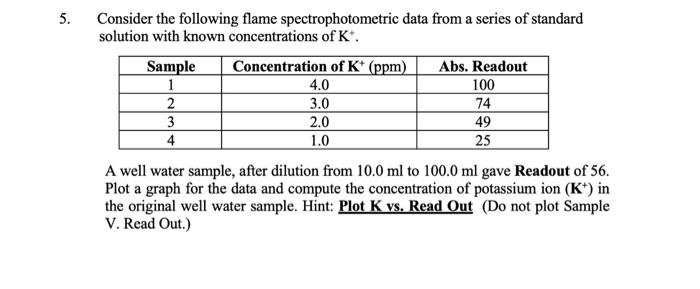
PLEASE put in excel form on plotting the graph And write equation when its ONLY A STRAIGHT LINE.
Also I would need put into graph in EXCEL form
(No handwritten Graph)
Has to BE STRAIGHT LINE. (LINEAR GRAPH)
5. Consider the following flame spectrophotometric data from a series of standard solution with known concentrations of K. Sample Concentration of K+ (ppm) Abs. Readout 1 4.0 100 2 3.0 74 3 2.0 49 4 1.0 25 A well water sample, after dilution from 10.0 ml to 100.0 ml gave Readout of 56. Plot a graph for the data and compute the concentration of potassium ion (K*) in the original well water sample. Hint: Plot K vs. Read Out (Do not plot Sample V. Read Out.)
Step by Step Solution
There are 3 Steps involved in it
1 Expert Approved Answer
Step: 1 Unlock

Question Has Been Solved by an Expert!
Get step-by-step solutions from verified subject matter experts
Step: 2 Unlock
Step: 3 Unlock