

Question: Would you be able to explain how you get the answers as well, I have tried for hours. Read the following Excel regression output and
Would you be able to explain how you get the answers as well, I have tried for hours.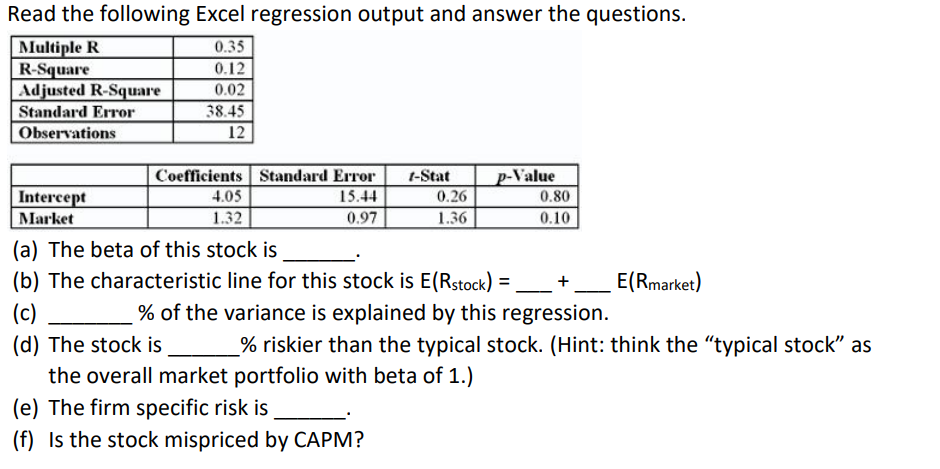
Read the following Excel regression output and answer the questions. Multiple R R-Square djusted R-Square Standard Error Observations 0.12 0.02 38.45 12 Coefficients Standard Errort-Stat Value 4.05 1.32 15.44 0.97 0.26 1.36 0.80 0.10 Intercent Market (a) The beta of this stock is (b) The characteristic line for this stock is E(Rstock) E(Rmarket) % of the variance is explained by this regression. (d) The stock is % riskier than the typical stock. (Hint: think the "typical stock" as the overall market portfolio with beta of 1.) (e) The firm specific risk is (f) Is the stock mispriced by CAPM
Step by Step Solution
There are 3 Steps involved in it

Get step-by-step solutions from verified subject matter experts