Question: Would you mind explaining the points as a presentation speech? Lean management and six sigma. 1.2 Symbols A VSM utilizes symbols to depict as well
Would you mind explaining the points as a presentation speech?
Lean management and six sigma.
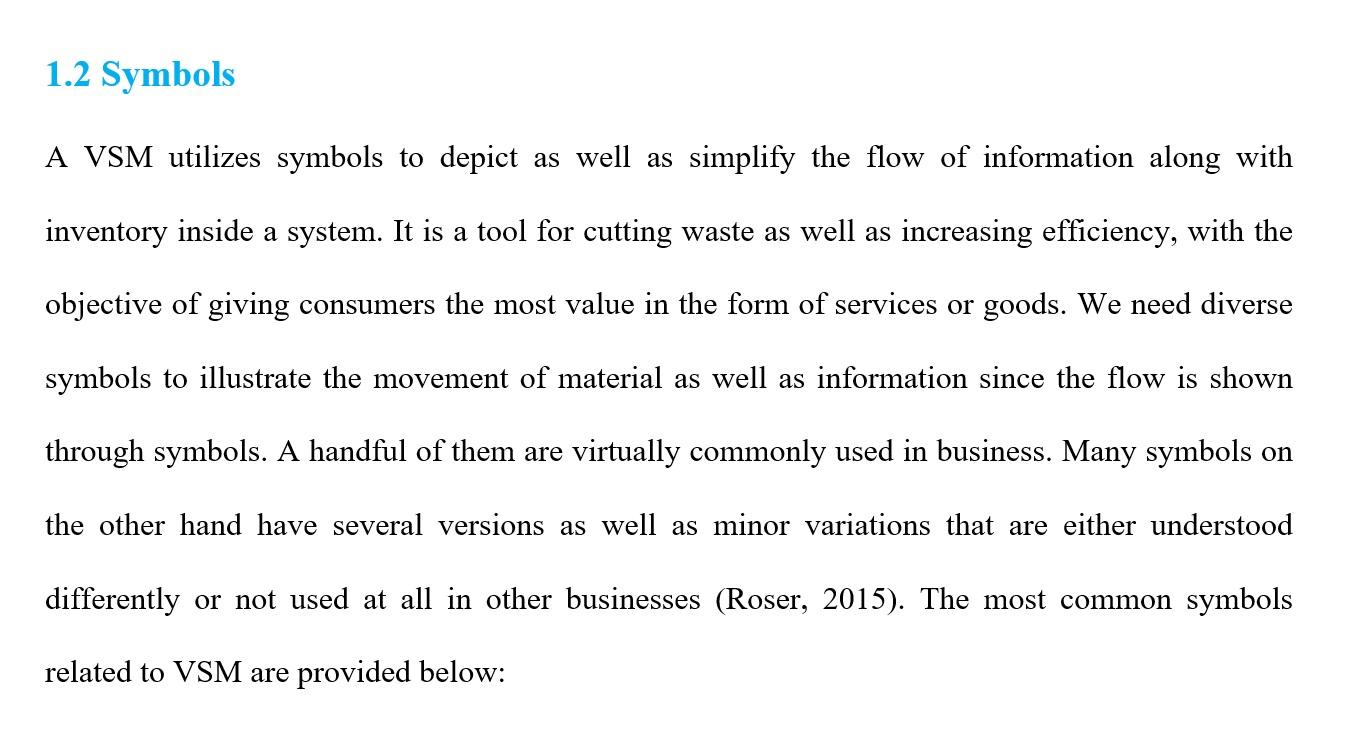
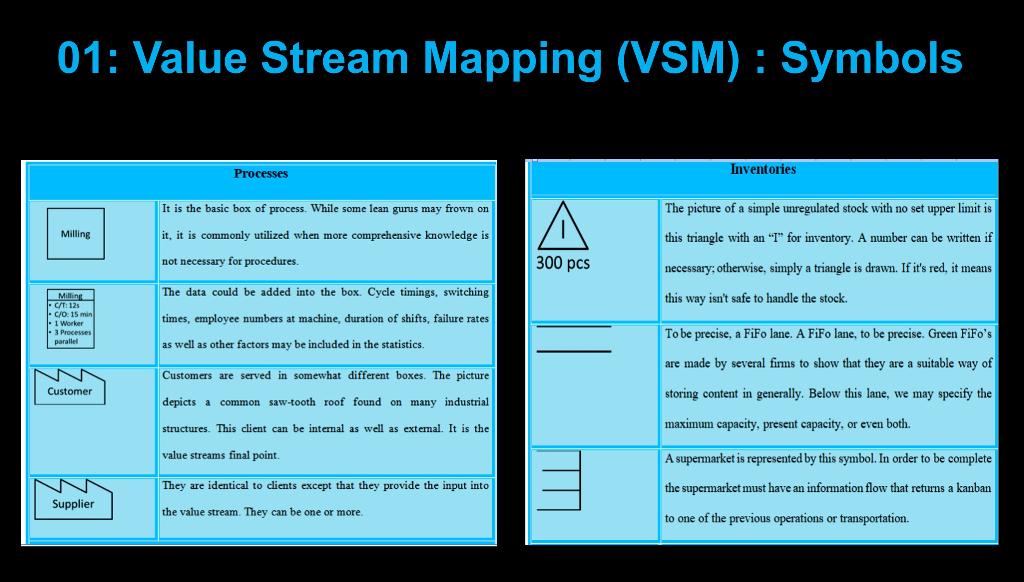
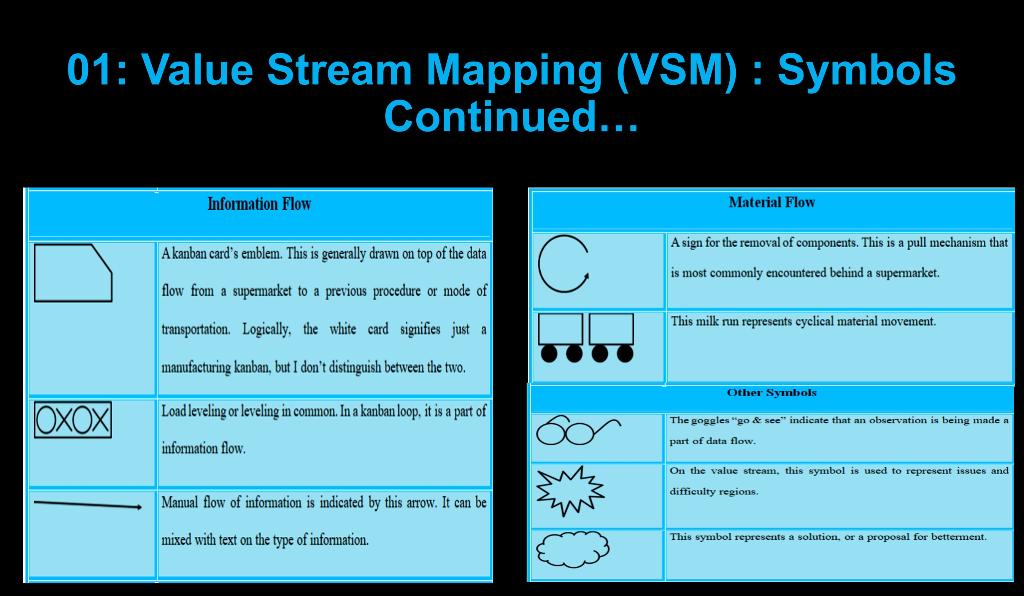
1.2 Symbols A VSM utilizes symbols to depict as well as simplify the flow of information along with inventory inside a system. It is a tool for cutting waste as well as increasing efficiency, with the objective of giving consumers the most value in the form of services or goods. We need diverse symbols to illustrate the movement of material as well as information since the flow is shown through symbols. A handful of them are virtually commonly used in business. Many symbols on the other hand have several versions as well as minor variations that are either understood differently or not used at all in other businesses (Roser, 2015). The most common symbols related to VSM are provided below: 01: Value Stream Mapping (VSM): Symbols Processes Inventories It is the basic box of process. While some lean gurus may frown on it, it is commonly utilized when more comprehensive knowledge is not necessary for procedures. The picture of a simple unregulated stock with no set upper limit is this triangle with an "I" for inventory. A number can be written if Milling 300 pcs necessary, otherwise, simply a triangle is drawn. If it's red, it means Milling - 12 | C/O: 15 min Worker - 3 Processes parallel The data could be added into the box. Cycle timings, switching times, employee numbers at machine, duration of shifts, failure rates this way isn't safe to handle the stock. To be precise, a Fifo lane. A Fifo lane, to be precise. Green FiFo's as well as other factors may be included in the statistics are made by several firms to show that they are a suitable way of Customer Customers are served in somewhat different boxes. The picture depicts a common saw-tooth roof found on many industrial storing content in generally. Below this lane, we may specify the structures. This client can be internal as well as extemal. It is the maximum capacity, present capacity, or even both. value streams final point. A supermarket is represented by this symbol. In order to be complete the supermarket must have an information flow that returns a kanban They are identical to clients except that they provide the input into Supplier the value stream. They can be one or more to one of the previous operations or transportation. 01: Value Stream Mapping (VSM): Symbols Continued... Information Flow Material Flow A sign for the removal of components. This is a pull mechanism that A kanban card's emblem. This is generally drawn on top of the data is most commonly encountered behind a supermarket. flow from a supermarket to a previous procedure or mode of transportation. Logically, the white card signifies just a This milk run represents cyclical material movement. manufacturing kanban, but I don't distinguish between the two. Other Symbols OXOX Load leveling or leveling in common. In a kanban loop, it is a part of The goggles "go & see" indicate that an observation is being made a part of data flow information flow. On the value stream, this symbol is used to represent issues and difficulty regions. Manual flow of information is indicated by this arrow. It can be mixed with text on the type of information This symbol represents a solution, or a proposal for betterment


