

Question: Would you please answer it by showing the steps? DON'T USE EXCEL OR ANOVA OR ANY EXTERNAL TOOLS. Also, I found many answers in Chegg,
Would you please answer it by showing the steps? DON'T USE EXCEL OR ANOVA OR ANY EXTERNAL TOOLS. Also, I found many answers in Chegg, but I don't understand it. Thank you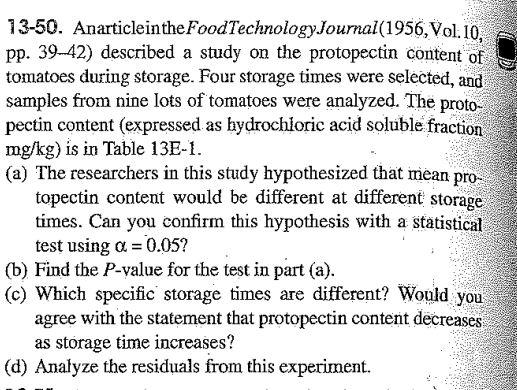
Would you please answer it by showing the steps and don't use excel or any external tools? Also, I found many answers in Chegg, but I don't understand it. Thank you
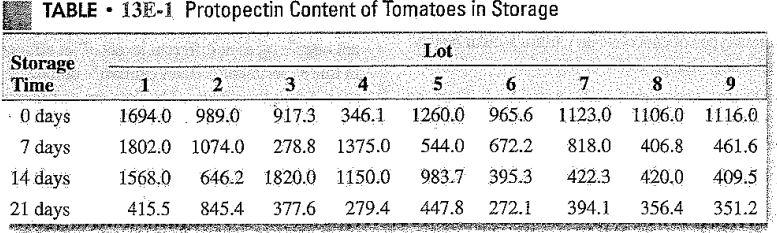
13-50. Anarticleinthe FoodTechnology Journal(1956, Vol. 10, pp. 39-42) described a study on the protopectin content of tomatoes during storage. Four storage times were selected, and samples from nine lots of tomatoes were analyzed. The proto- pectin content (expressed as hydrochloric acid soluble fraction mg/kg) is in Table 13E-1. (a) The researchers in this study hypothesized that mean pro- topectin content would be different at different storage times. Can you confirm this hypothesis with a statistical test using a = 0.05? (b) Find the P-value for the test in part (a). c) Which specific storage times are different? Would you agree with the statement that protopectin content decreases as storage time increases? (d) Analyze the residuals from this experiment. TABLE 13E-1 Protopectin Content of Tomatoes in Storage Lot Storage Time 0 days 8 9 7 days 1 2 3 4 1694.0 989.0 917.3 346.1 1802:0 1074.0 278.8 1375.0 1568.0 646.2 1820.0 1150.0 415.5 845.4 377.6 279.4 5 6 7 1260.0 965.6 1123.0 544.0 672.2 818.0 983.7 395.3 422.3 447.8 272.1 394.1 1106.0 1116.0 406.8 461.6 420.0 409.5 356.4 351.2 14 days 21 days 13-50. Anarticleinthe FoodTechnology Journal(1956, Vol. 10, pp. 39-42) described a study on the protopectin content of tomatoes during storage. Four storage times were selected, and samples from nine lots of tomatoes were analyzed. The proto- pectin content (expressed as hydrochloric acid soluble fraction mg/kg) is in Table 13E-1. (a) The researchers in this study hypothesized that mean pro- topectin content would be different at different storage times. Can you confirm this hypothesis with a statistical test using a = 0.05? (b) Find the P-value for the test in part (a). c) Which specific storage times are different? Would you agree with the statement that protopectin content decreases as storage time increases? (d) Analyze the residuals from this experiment. TABLE 13E-1 Protopectin Content of Tomatoes in Storage Lot Storage Time 0 days 8 9 7 days 1 2 3 4 1694.0 989.0 917.3 346.1 1802:0 1074.0 278.8 1375.0 1568.0 646.2 1820.0 1150.0 415.5 845.4 377.6 279.4 5 6 7 1260.0 965.6 1123.0 544.0 672.2 818.0 983.7 395.3 422.3 447.8 272.1 394.1 1106.0 1116.0 406.8 461.6 420.0 409.5 356.4 351.2 14 days 21 days
Step by Step Solution
There are 3 Steps involved in it

Get step-by-step solutions from verified subject matter experts