

Question: Would you please answer this? AutoSave . Off) 12 -Output-04-W5 - Compatibility Mode - Word Search Helen Grace De Leon HG X File Home Insert
Would you please answer this?
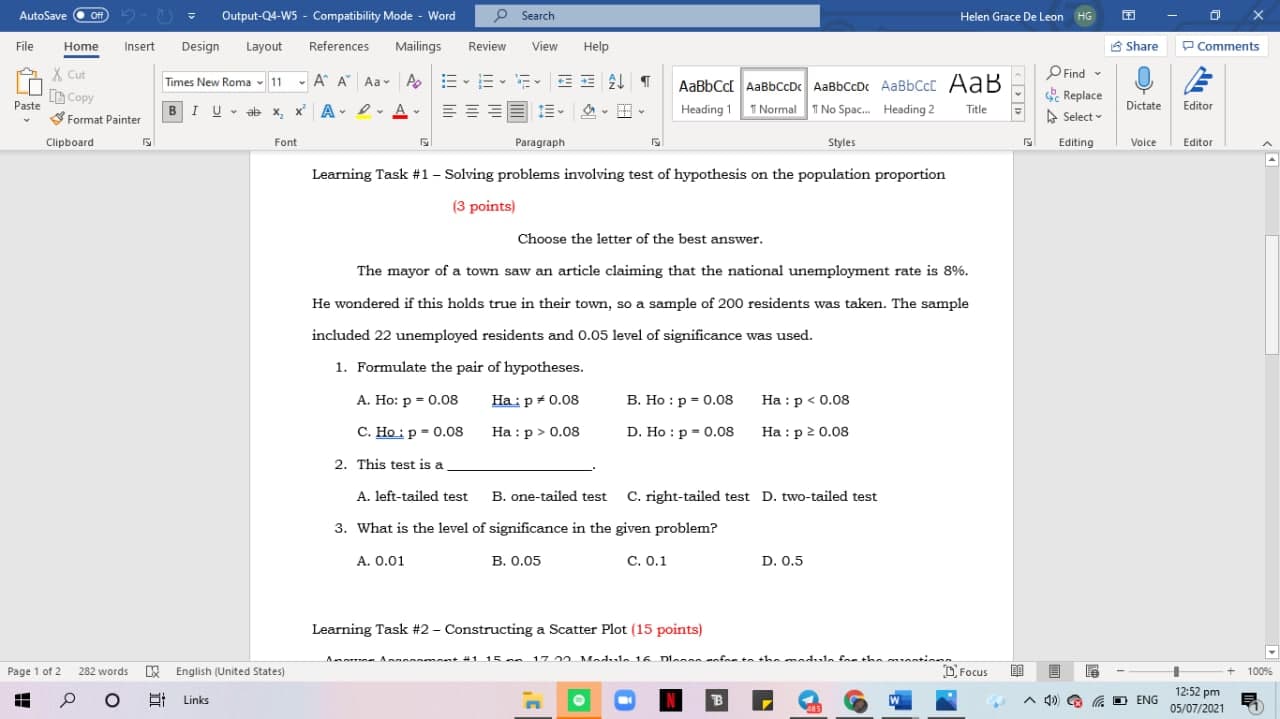
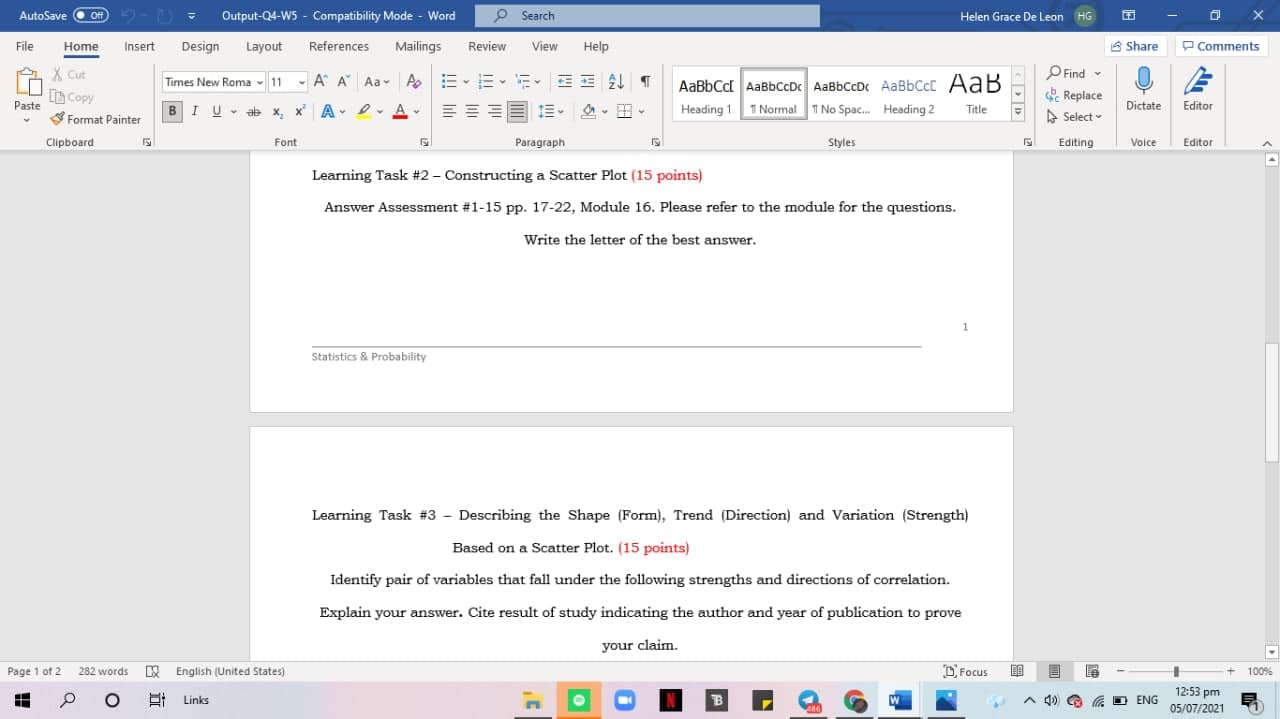
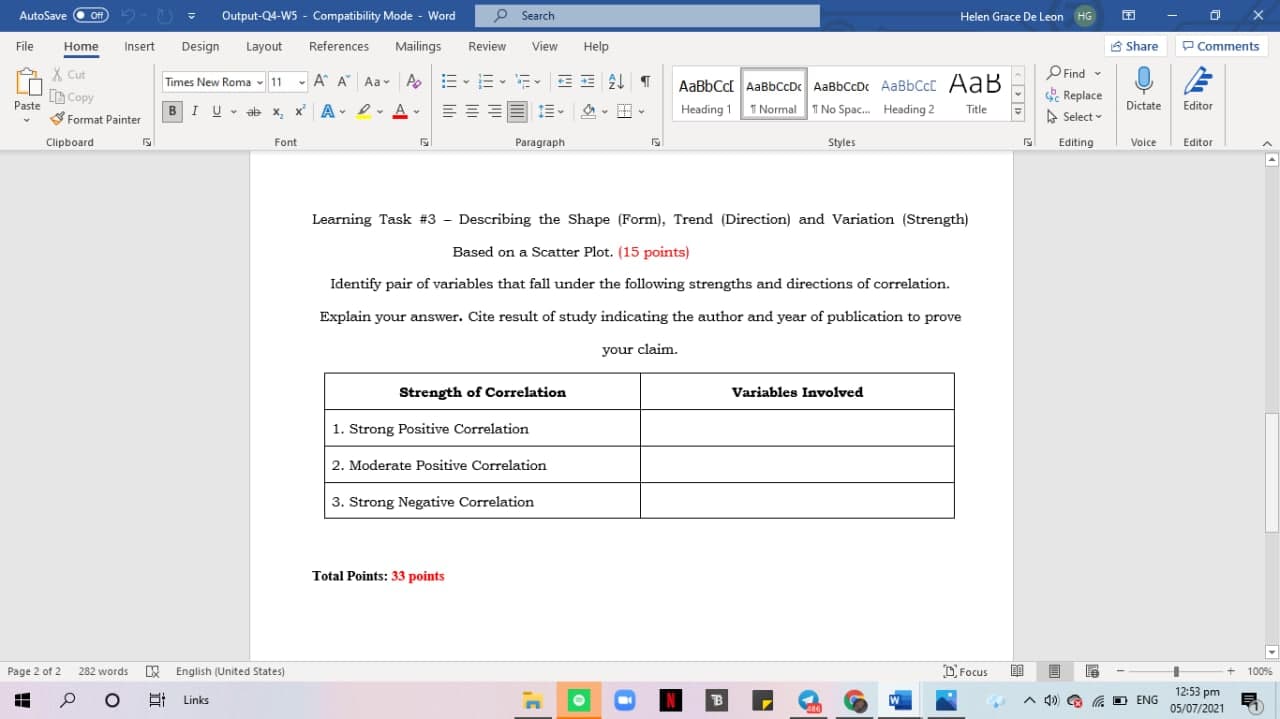
AutoSave . Off) 12 -Output-04-W5 - Compatibility Mode - Word Search Helen Grace De Leon HG X File Home Insert Design Layout References Mailings Review View Help Share Comments X Cut Times New Roma - 11 - A A Aa A Find [ Copy AaBbCc[ AaBbCcDc AaBbCcDc AaBbCct AaB Replace Paste Heading 1 Normal 1 No Spac... Heading 2 Title Dictate Editor Format Painter BIU -a x X A DA- Select Clipboard Font Paragraph Styles Editing Voice Editor Learning Task #1 - Solving problems involving test of hypothesis on the population proportion (3 points) Choose the letter of the best answer. The mayor of a town saw an article claiming that the national unemployment rate is 8%. He wondered if this holds true in their town, so a sample of 200 residents was taken. The sample included 22 unemployed residents and 0.05 level of significance was used. 1. Formulate the pair of hypotheses. A. Ho: p = 0.08 Ha : p #0.08 B. Ho : p = 0.08 Ha : p 0.08 D. Ho : p = 0.08 Ha : p 2 0.08 2. This test is a A. left-tailed test B. one-tailed test C. right-tailed test D. two-tailed test 3. What is the level of significance in the given problem? A. 0.01 B. 0.05 C. 0.1 D. 0.5 Learning Task #2 - Constructing a Scatter Plot (15 points) 1 15 an 17 50 Module 16 Dlam module for the ~ Page 1 of 2 282 words [ English (United States) D Focus + 100% Et Links B W A () GGDENG 12:52 pm 05/07/2021AutoSave . Off) 12 -Output-04-W5 - Compatibility Mode - Word Search Helen Grace De Leon HG X File Home Insert Design Layout References Mailings Review View Help Share PComments X Cut Times New Roma - 11 - A A Aa A Find [ Copy AaBbCc[ AaBbCcDc AaBbCcDc AaBbCct AaB Replace Paste Heading 1 Normal 1 No Spac... Heading 2 Title Dictate Editor Format Painter BIU -ax X A DA- Select Clipboard Font Paragraph Styles Editing Voice Editor Learning Task #2 - Constructing a Scatter Plot (15 points) Answer Assessment #1-15 pp. 17-22, Module 16. Please refer to the module for the questions. Write the letter of the best answer. Statistics & Probability Learning Task #3 - Describing the Shape (Form), Trend (Direction) and Variation (Strength) Based on a Scatter Plot. (15 points) Identify pair of variables that fall under the following strengths and directions of correlation. Explain your answer. Cite result of study indicating the author and year of publication to prove your claim. Page 1 of 2 282 words DO English (United States) Focus + 100% Et Links m O N B W A D GDENG 12:53 pm 05/07/2021AutoSave ( Off) 12 -Output-04-W5 - Compatibility Mode - Word Search Helen Grace De Leon HG X File Home Insert Design Layout References Mailings Review View Help Share PComments X Cut Find Times New Roma ~ 11 - A A Aa A AaBbCc[ AaBbCCDc AaBbCcDc AaBbCct AaB [ Copy Replace Paste BIU -ab x X A DA- Heading 1 1 Normal 1 No Spac... Heading 2 Title Dictate Editor Format Painter Select Clipboard Font Paragraph Styles Editing Voice Editor Learning Task #3 - Describing the Shape (Form), Trend (Direction) and Variation (Strength) Based on a Scatter Plot. (15 points) Identify pair of variables that fall under the following strengths and directions of correlation. Explain your answer. Cite result of study indicating the author and year of publication to prove your claim. Strength of Correlation Variables Involved 1. Strong Positive Correlation 2. Moderate Positive Correlation 3. Strong Negative Correlation Total Points: 33 points Page 2 of 2 282 words [ English (United States) DFocus + 100% N B GC W A D G DENG 12:53 pm Et Links O 05/07/2021
Step by Step Solution
There are 3 Steps involved in it

Get step-by-step solutions from verified subject matter experts