

Question: Would you please identify the relationship between the information in this graph and equity markets Monthly US, Consumer Surveys, Index, 1 Year Inflation Expectations (median)
Would you please identify the relationship between the information in this graph and equity markets
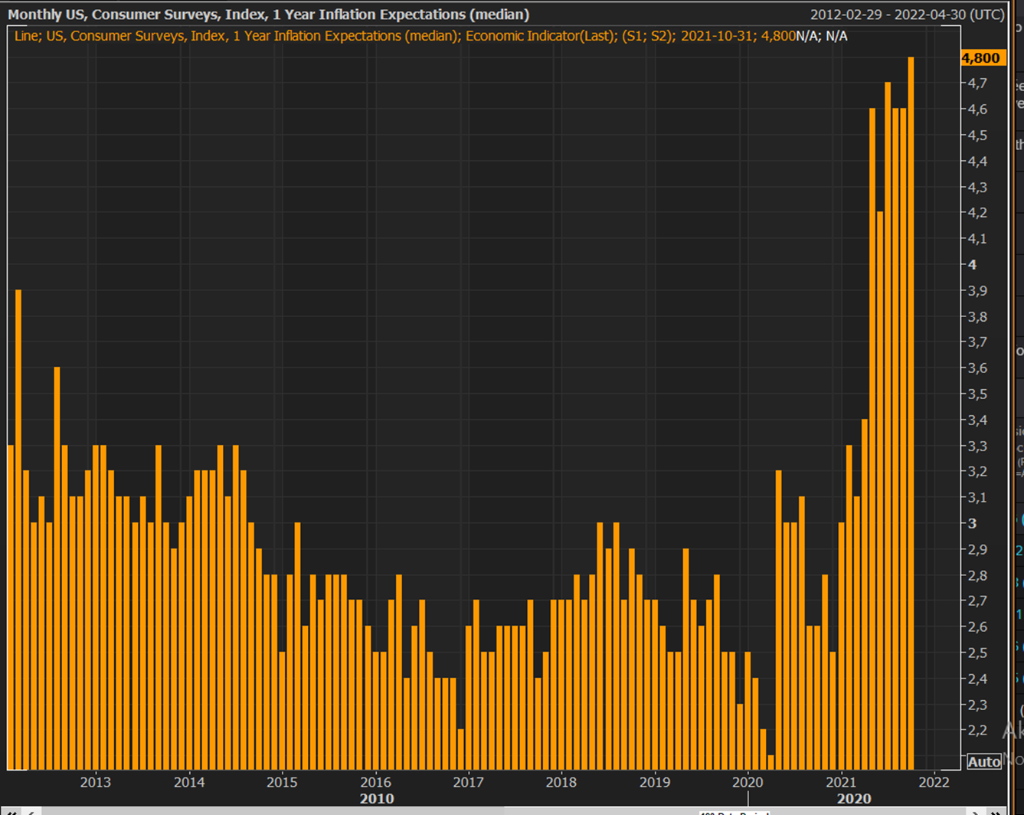
Monthly US, Consumer Surveys, Index, 1 Year Inflation Expectations (median) 2012-02-29 - 2022-04-30 (UTC) Line; US, Consumer Surveys, Index, 1 Year Inflation Expectations (median); Economic Indicator(Last); (51; 52); 2021-10-31; 4,800N/A; N/A 4,800 +4,7 +4,6 e 44,5 +4,4 F4,3 +4,2 F4,1 +4 F3,9 F3,8 3,7 F3,6 3,5 +3,4 3,3 F3,2 F3,1 +3 F2,9 F2,8 72,7 +2,6 -2,5 +2,4 2,3 +2,2 AT Auto 2013 2014 2015 2017 2018 2019 2020 2022 2016 2010 2021 2020
Step by Step Solution
There are 3 Steps involved in it
1 Expert Approved Answer
Step: 1 Unlock

Question Has Been Solved by an Expert!
Get step-by-step solutions from verified subject matter experts
Step: 2 Unlock
Step: 3 Unlock