

Question: Would you please provide a detailed visual representation in Excel, and how to calculate and use Solver for the following scenario? Overview Data analysis and
Would you please provide a detailed visual representation in Excel, and how to calculate and use Solver for the following scenario?
Overview
Data analysis and communication of data to stakeholders are key factors in effective management. You cant efficiently manage unless you know if objectives are being met. You can use data and spreadsheets to find areas of concern and decide if progress is being made for key objectives. Reviewing data should be done continuously. This is where spreadsheets that are linked to data sources can give you an advantage. When input data values change, the spreadsheets dont need to be changed for them to calculate the results. You can use the data to measure the efficiencies or inefficiencies of key objectives.
Think about the plan-do-check-act management cycle. In this cycle, management plans for a set of objectives, develops processes, and allocates resources; the company will carry out (or do) the plans. Management also monitors how well the set objectives are being met. Then feedback is given (the check). Based on feedback, changes to the plans are made (the act). You will create an analysis report for the final project of this course. Your report will show your ability to logically look at large amounts of raw data. This data can be used to make sure resources are used in a way that increases profits as much as possible. Youll create a report that includes your analysis of sales, costs, and profit. Doing so will allow you to have an overall understanding of performance that can be used for stakeholder decision-making.
Directions
In the case study, youre creating a number of spreadsheets to measure specific aspects of a winery and its distribution operation. Certain factors, such as increasing wine production significantly or lowering production costs, need a lot of time to enact. However, changes related to distribution can be made quickly using spreadsheets. In the case study, new management wants to understand how efficiently the distribution system is working. Youll study the data, then present it in a way that can be clearly explained to the key stakeholders.
Specifically, you must address the following rubric criteria:
Organizational Sales: This is the first part of your final project. Youll review raw data sets that summarize the production, sales, and distribution of wine. Youll need to analyze the various types of wine and different distribution centers to figure out how they affect the organizations total revenue. All of your analyses need to be submitted in an annotated Excel file. Each analysis needs to include your reasons for using the appropriate Excel functions.
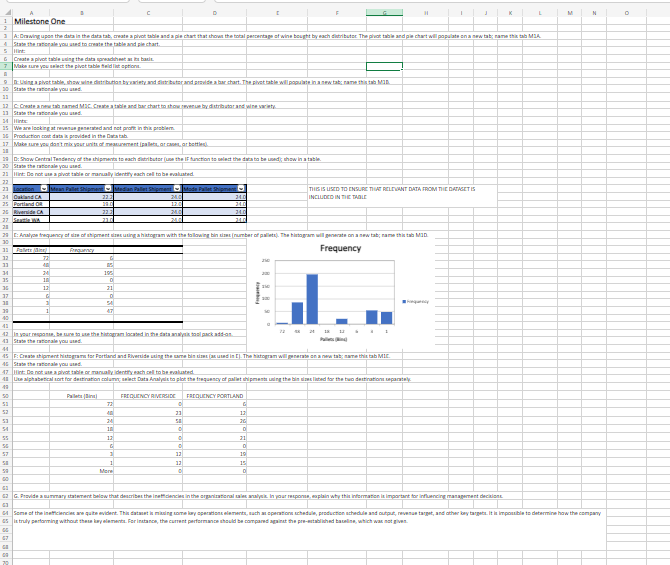
A. Using a pivot table, figure out the percentage of wine sold by distribution center. Show your results in a pie chart.
B. Generate a labeled bar chart that shows the sum of wine varieties sold to each distribution center.
C. Use the pivot table already created to calculate the total amount of revenue made for each distribution center. Show your results in a bar chart.
D. Use the IF function to calculate the central tendencies (mean, median, and mode) of shipment volume for each distribution center. Show your results in a table.
E. Analyze the frequency of shipments by size using a histogram.
F. Create a shipment histogram to show the distribution of shipments for Portland and Riverside.
G. Write a summary statement that describes the inefficiencies in the organizational sales analysis. In your response, explain why this information is important for influencing management decisions.
Organizational Cost and Profit: This is the next part of your final project. Use your findings and raw data from the previous section to dive deeper into types of wine and distribution centers. You will need to analyze these factors to figure out average costs and profits. All of your analyses need to be submitted in an annotated Excel file and include your reasoning.
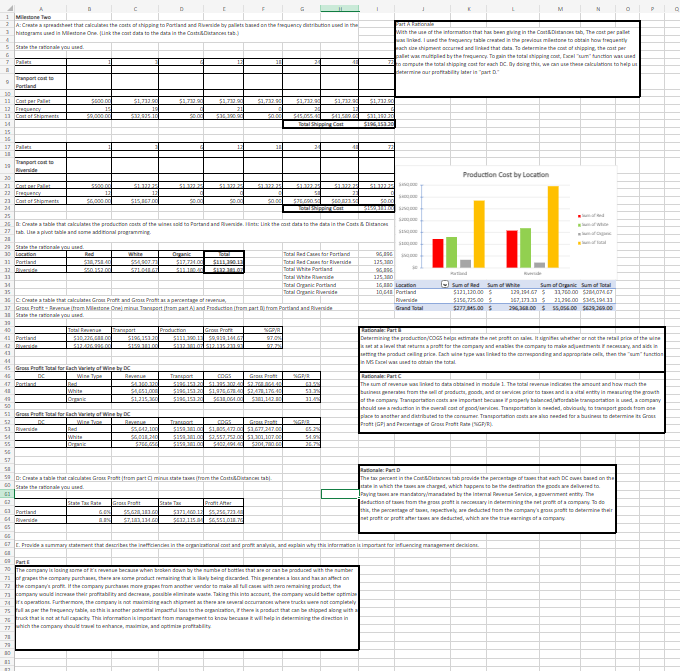
A. Calculate the costs of shipping to Portland and Riverside by pallets and frequency. Show your results in a table.
B. Calculate the cost of production for the wine varieties sold in Portland and Riverside. Show your results in a table.
C. Generate alabeled table that shows gross profit for each variety of wine for each distribution center. Explain why this information is important for informing operation efficiencies.
D. Generate a labeled table that shows the profit after state taxes.
E. Write a summary statement that describes the inefficiencies in the organizational cost and profit analysis. Explain why this information is important for influencing management decisions.
Optimizing Performance: Finally, youll decide on an optimal solution that will maximize the organizations objectives. Youll need to think about the level of sensitivity and uncertainty of other solutions in supporting your optimal solution. The analyses need to be submitted in an annotated Excel file and include your reasoning.
A. Decide on the values of the constraints to be used to generate the target number when running Solver.
B. Using Solver, calculate the level of sensitivity of decision variables and explain the importance of the report.
C. Using Solver, calculate the limits of decision variables and explain the importance of the report.
D. Identify solutions that will maximize profits for the organization based on the Solver analysis.
Vinho Winery Scenario
The Vinho Winery in Lodi, California, produces about one million cases of wine a year. They sell their wine wholesale to four independent wine distributors in Riverside, CA; Oakland, CA; Portland, OR; and Seattle, WA. Vinho Winery produces three varieties of wine: Ruby Red, Murky White, and Whole-Earth Organic. They use different grapes to produce the three varieties. Their production volumes (increased by grapes bought from other growers) must be planned at least a year in advance of being pressed into wine. The wine must be aged a year before being sold.
Vinho Winery advertises their wines in the areas surrounding their four independent wine distributors. The cost of this marketing is included in the wine production costs. Vinho has a contract with a private trucking company to move full truckloads of wine. A full truck will carry 24 pallets of wine, totaling 2,688 cases (16,128 bottles). The minimum shipment they will sell is a pallet of wine (112 cases).
They contract out delivery of the pallets unless the cost rises higher than the cost of using one of their private trucking companys trucks. Vinho has brokers arrange cargo to be carried on the return trip (backhaul) to avoid their trucks returning empty, resulting in needing to pay for the round trip. Little Lodi is not a major transportation destination, so only part of the return trip can be used. (For example, the return from Seattle can be used to move cargo from Seattle to Eureka, but not all the way to Lodi.)
A private equity firm recently bought Vinho Winery. They want an assessment of current operations. Once that is complete, they want plans to optimize operations. Youre the management consultant wholl conduct the assessment and develop the plans. Youll need to create and program spreadsheets for your analysis, then write summary statements.
You do more research on wine production and realize that it takes 3.5 pounds of grapes to make a bottle of wine. In addition, you know the price per bottle that the distributors are paying for each variety of wine:
| Price for Red Wine ($ | Price for White Wine ($) | Price for Organic Wine ($) |
| 7.50 | 8.00 | 12.00 |
You discuss wine production with the operations manager. You learn that the wineries that supply the grapes to produce the above types of wine can produce up to a total of 200,000 pounds of grapes for a six-month supply of wine bottles for the three markets. The following are the expected distribution constraints based on types of grapes. Note that current market needs will not support more than the below constraints for each type:
| Red Wine Ceiling | 22,000 bottles |
| White Wine Ceiling | 24,000 bottles |
| Organic Wine Ceiling | 12,000 bottles |
The production cost per bottle stays the same as before. So the percentages of sales or revenue are 32% for red wine, 42.5% for white wine, and 52.5% for organic wine. You have gathered this additional information and are now ready to figure out the optimum production mix to maximize profit.
Final Section
III - Optimizing Performance
| For the Lodi Winery, you have been asked by management to examine the data collected and analyzed in the previous modules. The objective is for you to help management decide on the right mix of wine bottles to sell based on newly derived profit information while considering the limitations of the particular types of grapes available for production. While doing more research on wine production, you realize that it takes 3.5 pounds of grapes to make a bottle of wine. In addition, you already were provided the price per bottle that the distributors are paying for each variety of wine: |
| Price for Red Wine | Price for White Wine | Price for Organic Wine |
| 7.5 | 8 | 12 |
| After discussing wine production with the operations manager, you also learn that the wineries that supply the grapes to produce the above types of wine can produce up to a total of 200,000 pounds of grapes for a six-month supply of wine bottles for the three markets, with the following expected distribution constraints based on types of grapes. Note that current market demand will not support more than the below constraints for each type: |
| Red Wine Ceiling | 22,000 bottles |
| White Wine Ceiling | 24,000 bottles |
| Organic Wine Ceiling | 12,000 bottles |
Note that the production cost per bottle remains the same as before, that is 32% of sales or revenue for red wine, 42.5% of sales for white wine, and 52.5% of sales for organic wine. With additional information you have gathered, you are now ready to determine the optimum production mix to maximize profit.
Step by Step Solution
There are 3 Steps involved in it

Get step-by-step solutions from verified subject matter experts