

Question: Write 2 research questions based on the variables in the table and answer them using the statistics provided. Could you come up with some explanations
Write 2 research questions based on the variables in the table and answer them using the statistics provided. Could you come up with some explanations for the results?
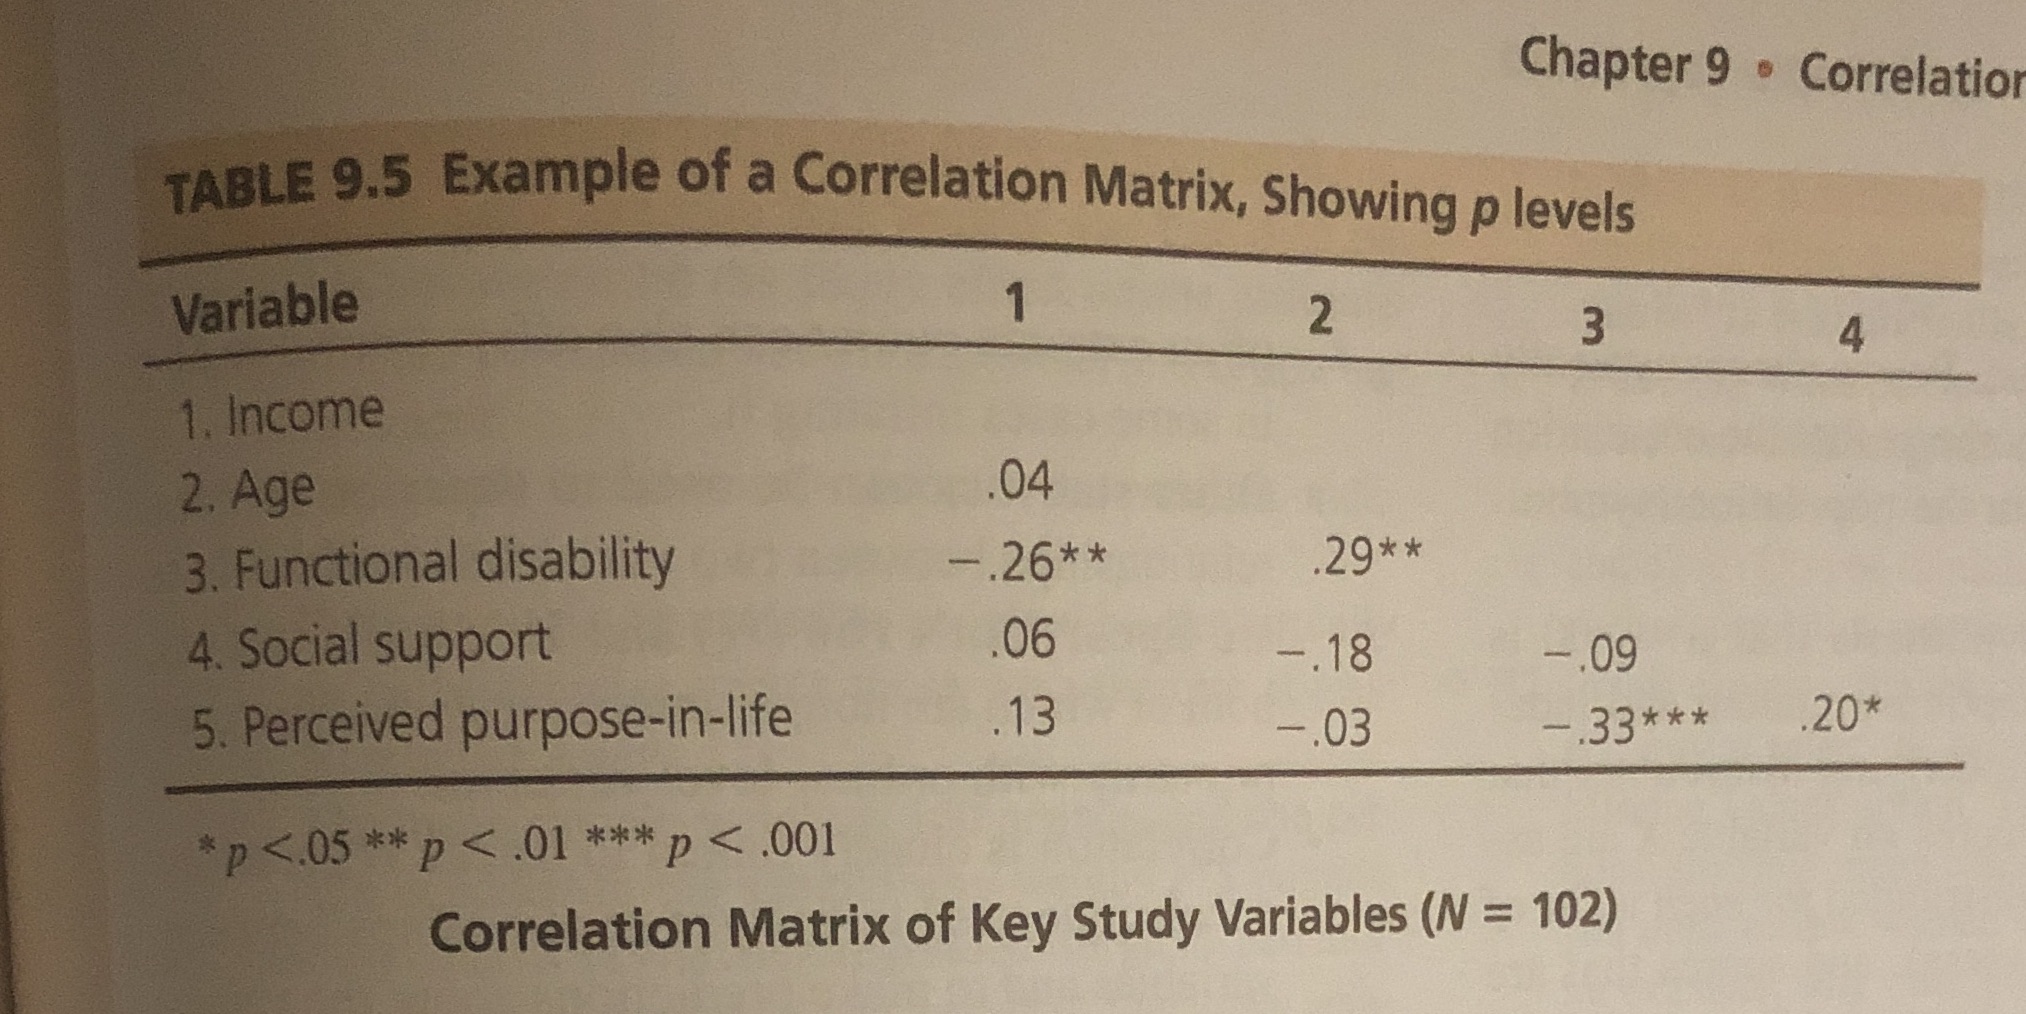
Chapter 9 . Correlation TABLE 9.5 Example of a Correlation Matrix, Showing p levels Variable 2 W 4 1. Income 2. Age .04 3. Functional disability -.26* * 29* * 4. Social support .06 -. 18 -.09 5. Perceived purpose-in-life .13 -.03 .33* * * .20* * p <.05 .01 p correlation matrix of key study variables>
Step by Step Solution
There are 3 Steps involved in it
1 Expert Approved Answer
Step: 1 Unlock

Question Has Been Solved by an Expert!
Get step-by-step solutions from verified subject matter experts
Step: 2 Unlock
Step: 3 Unlock