

Question: Write a code in R PROGRAM to solve this 7) The list below provides snowfall data for 50 consecutive years in Buffalo, NY (in inches
Write a code in R PROGRAM to solve this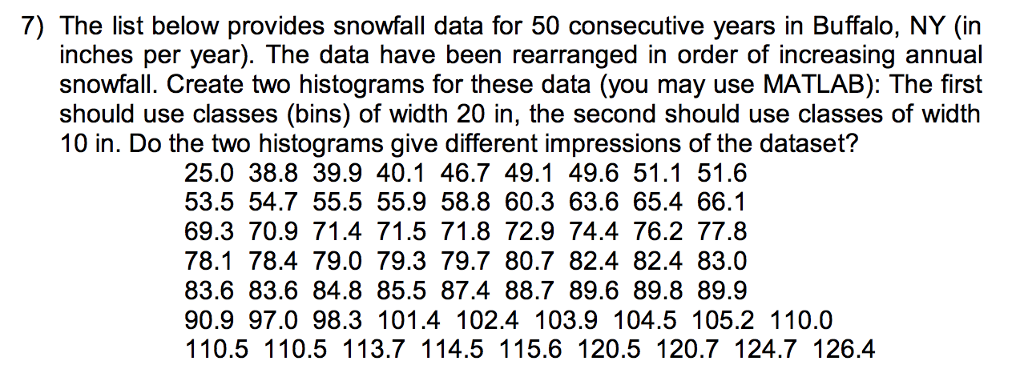
7) The list below provides snowfall data for 50 consecutive years in Buffalo, NY (in inches per year). The data have been rearranged in order of increasing annual snowfall. Create two histograms for these data (you may use MATLAB): The first should use classes (bins) of width 20 in, the second should use classes of width 10 in. Do the two histograms give different impressions of the dataset? 25.0 38.8 39.9 40.1 46.7 49.1 49.6 51.1 51.6 53.5 54.7 55.5 55.9 58.8 60.3 63.6 65.4 66.1 69.3 70.9 71.4 71.5 71.8 72.9 74.4 76.2 77.8 78.1 78.4 79.0 79.3 79.7 80.7 82.4 82.4 83.0 83.6 83.6 84.8 85.5 87.4 88.7 89.6 89.8 89.9 90.9 97.0 98.3 101.4 102.4 103.9 104.5 105.2 110.0 110.5 110.5 113.7 114.5 115.6 120.5 120.7 124.7 126.4
Step by Step Solution
There are 3 Steps involved in it

Get step-by-step solutions from verified subject matter experts