Question: Write a detail report on MS-word using a proper formatting (table of content,cover page and etc) Detail report of your work on MS word include

Write a detail report on MS-word using a proper formatting (table of content,cover page and etc)

  • Detail report of your work on MS word include Introduction, Summary of report, summary of excel sheet, conclusion, and references.
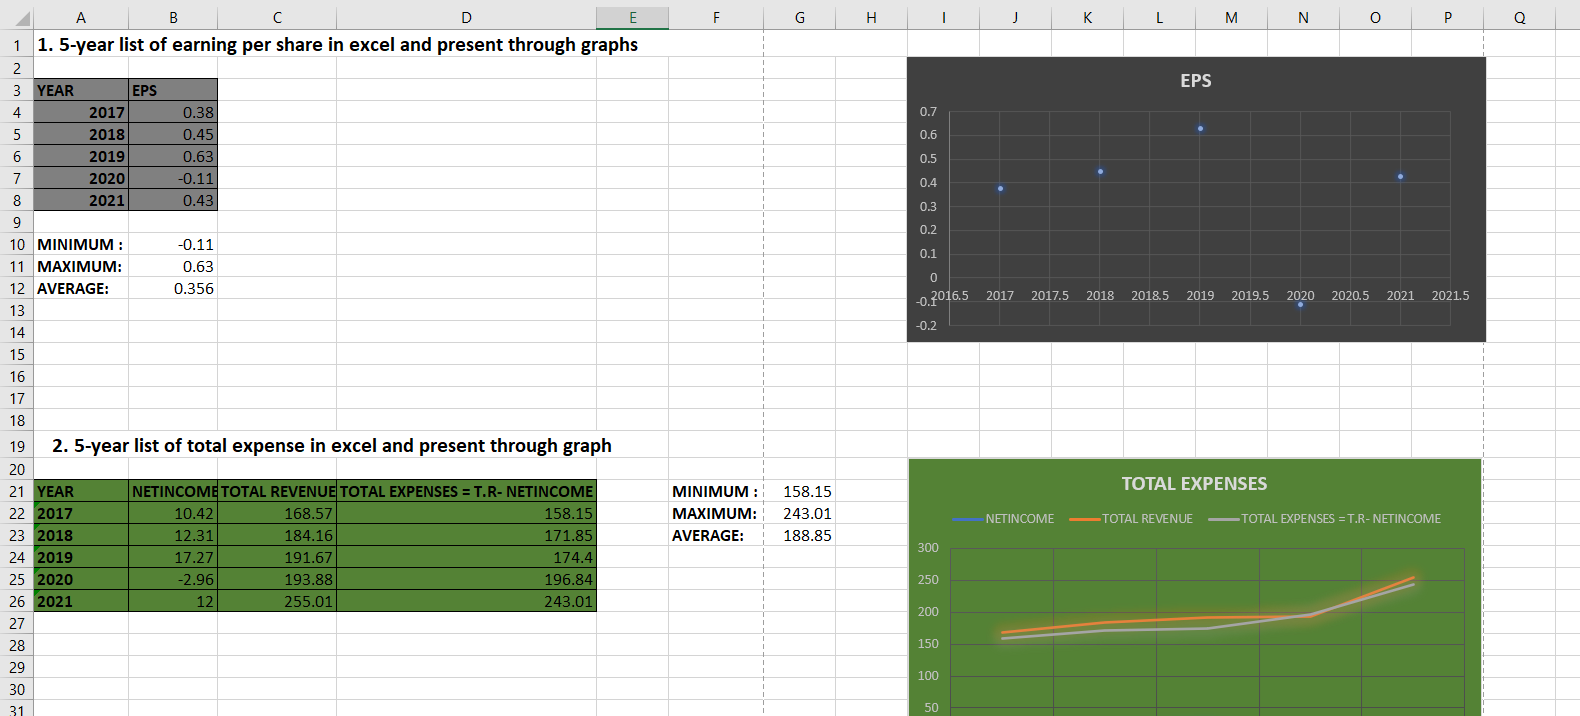
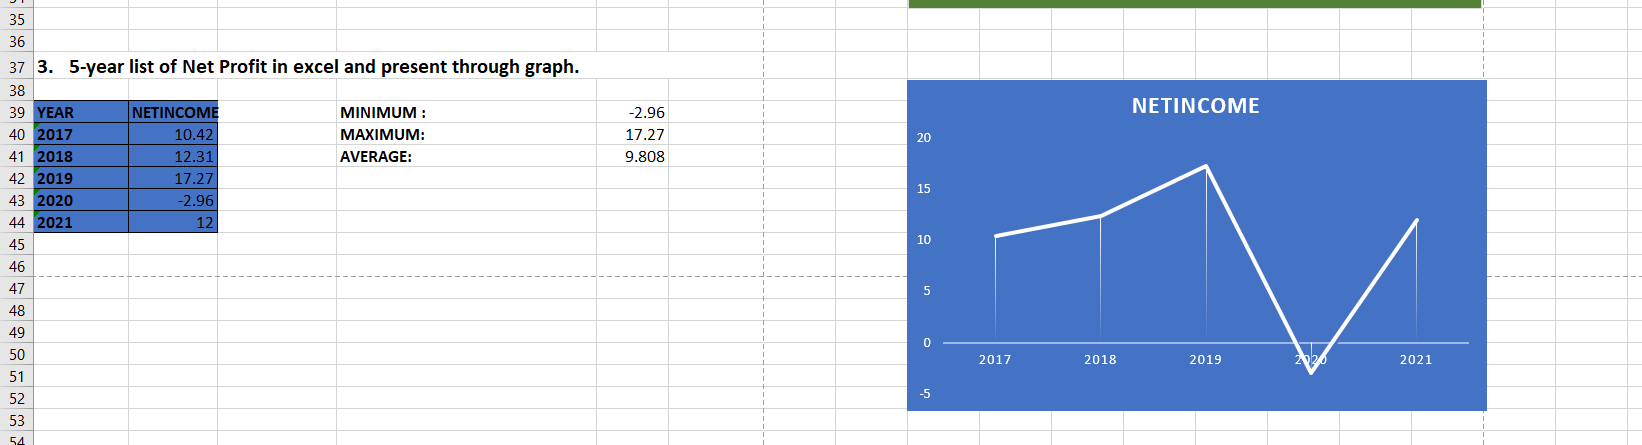
  • company name is K-ELECTRIC LIMITED (PAKISTAN STOCK EXCHNAGE)
  • EXCEL SHEETS ARE GIVEN BELOW,
  • NOTE: Project with less than equal to 30% plagiarism will be accepted
  • IT SHOULD BE NOT LESS THAN 10 PAGES

Write a detail report on MS-word using a properWrite a detail report on MS-word using a proper

F G H J L M N o Q EPS 0.7 0.6 0.5 0.4 0.3 0.2 0.1 0 -0.2016, 2017 2017.5 2018 2018.5 2019 2019.5 2020 2020.5 2021 2021.5 -0.2 A B D 1 1. 5-year list of earning per share in excel and present through graphs 2 3 YEAR EPS 4 2017 0.38 5 2018 0.45 6 2019 0.63 7 2020 -0.11 8 2021 0.43 9 10 MINIMUM : -0.11 11 MAXIMUM: 0.63 12 AVERAGE: 0.356 13 14 15 16 17 18 19 2. 5-year list of total expense in excel and present through graph 20 21 YEAR NETINCOME TOTAL REVENUE TOTAL EXPENSES = T.R- NETINCOME 22 2017 10.42 168.57 158.15 23 2018 12.31 184.16 171.85 24 2019 17.27 191.67 174.4 25 2020 -2.96 193.88 196.84 26 2021 12 255.01 243.01 27 28 29 30 31 TOTAL EXPENSES MINIMUM : MAXIMUM: AVERAGE: 158.15 243.01 188.85 NETINCOME TOTAL REVENUE -TOTAL EXPENSES = T.R-NETINCOME 300 250 200 150 100 50 NETINCOME -2.96 17.27 9.808 20 15 35 36 37 3. 5-year list of Net Profit in excel and present through graph. 38 39 YEAR NETINCOME MINIMUM: 40 2017 10.42 MAXIMUM: 41 2018 12.31 AVERAGE: 42 2019 17.27 43 2020 -2.96 44 2021 12 45 46 47 48 49 50 51 52 53 54 10 5 0 2017 2018 2019 2021 -5 F G H J L M N o Q EPS 0.7 0.6 0.5 0.4 0.3 0.2 0.1 0 -0.2016, 2017 2017.5 2018 2018.5 2019 2019.5 2020 2020.5 2021 2021.5 -0.2 A B D 1 1. 5-year list of earning per share in excel and present through graphs 2 3 YEAR EPS 4 2017 0.38 5 2018 0.45 6 2019 0.63 7 2020 -0.11 8 2021 0.43 9 10 MINIMUM : -0.11 11 MAXIMUM: 0.63 12 AVERAGE: 0.356 13 14 15 16 17 18 19 2. 5-year list of total expense in excel and present through graph 20 21 YEAR NETINCOME TOTAL REVENUE TOTAL EXPENSES = T.R- NETINCOME 22 2017 10.42 168.57 158.15 23 2018 12.31 184.16 171.85 24 2019 17.27 191.67 174.4 25 2020 -2.96 193.88 196.84 26 2021 12 255.01 243.01 27 28 29 30 31 TOTAL EXPENSES MINIMUM : MAXIMUM: AVERAGE: 158.15 243.01 188.85 NETINCOME TOTAL REVENUE -TOTAL EXPENSES = T.R-NETINCOME 300 250 200 150 100 50 NETINCOME -2.96 17.27 9.808 20 15 35 36 37 3. 5-year list of Net Profit in excel and present through graph. 38 39 YEAR NETINCOME MINIMUM: 40 2017 10.42 MAXIMUM: 41 2018 12.31 AVERAGE: 42 2019 17.27 43 2020 -2.96 44 2021 12 45 46 47 48 49 50 51 52 53 54 10 5 0 2017 2018 2019 2021 -5

Step by Step Solution

There are 3 Steps involved in it

1 Expert Approved Answer
Step: 1 Unlock blur-text-image
Question Has Been Solved by an Expert!

Get step-by-step solutions from verified subject matter experts

Step: 2 Unlock
Step: 3 Unlock

Students Have Also Explored These Related General Management Questions!