

Question: Write a detailed MATLAB code to find the greatest similarity region between the signals (x , h) and then indicate it on a graph,using the
Write a detailed MATLAB code to find the greatest similarity region between the signals (x , h) and then indicate it on a graph,using the cross-correlation method to approach the solution.
The use of MATLAB's built-in functions for calculating convolution or cross-correlation is not allowed
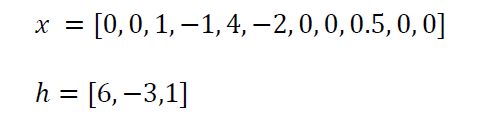 (x is already zero padded)
the cross-correlation between two discrete-time signals is defined as:
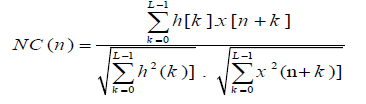
while L is the length of h, and n is calculated by (the length of x +the length of L -1)in this case n =11
X = = [0,0,1,-1,4,2,0,0,0.5, 0, 0] h = [6, 3,1] L-1 h[k].x [n+k] k-O NC (n)= L-1 L-1 Eh(k)] . Xx?(n+k)] k-O k-O
Step by Step Solution
There are 3 Steps involved in it
1 Expert Approved Answer
Step: 1 Unlock

Question Has Been Solved by an Expert!
Get step-by-step solutions from verified subject matter experts
Step: 2 Unlock
Step: 3 Unlock