

Question: Write a few sentences annotating the scatter graph. Describe any trends, holes in the data, or observations. Remember that your audience may not be familiar
Write a few sentences annotating the scatter graph. Describe any trends, holes in the data, or observations. Remember that your audience may not be familiar with cost visualization.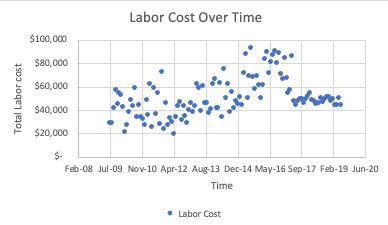
Total Labor cost Labor Cost Over Time $100,000 $80,000 $60,000 $40,000 $20,000 $- Feb-08 Jul-09 Nov-10 Apr-12 Aug-13 Dec-14 May-16 Sep-17 Feb-19 Jun-20 Time Labor Cost www.
Step by Step Solution
There are 3 Steps involved in it
1 Expert Approved Answer
Step: 1 Unlock

Step 11 Solution The scatter graph shows the relationship between Time and Lab... View full answer
Question Has Been Solved by an Expert!
Get step-by-step solutions from verified subject matter experts
Step: 2 Unlock
Step: 3 Unlock