

Question: Write a function [] = my3DsurfacePlot (x,y) accepts inputs x (1x n double array) and y (1xn double array) and generates the shaded surface plot
![Write a function [] = my3DsurfacePlot (x,y) accepts inputs x (1x](https://dsd5zvtm8ll6.cloudfront.net/si.experts.images/questions/2024/09/66f4facd3f3cf_02066f4facc9c8de.jpg)
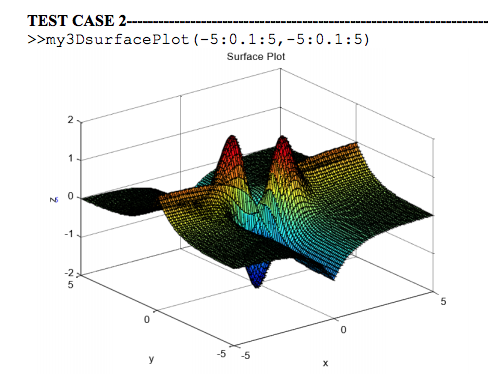
Write a function [] = my3DsurfacePlot (x,y) accepts inputs x (1x n double array) and y (1xn double array) and generates the shaded surface plot of the function: xy elvl eltx] The function should generate the surface plots and label the x, y, and z, axis along with adding a title "Surface Plot". The function should also set the range of the x-, y-, and z-axis so the plot only displays from the minimum value to the maximum value of the respective axes. Hint: Look up the built-in function surf to generate shaded surface plots. TEST CASE 1 >> my3Dsurface Plot (-2: 0 . 2 :2,-2: 02: 2) Surface Plot -2 0 -1 -2 2
Step by Step Solution
There are 3 Steps involved in it
1 Expert Approved Answer
Step: 1 Unlock

Question Has Been Solved by an Expert!
Get step-by-step solutions from verified subject matter experts
Step: 2 Unlock
Step: 3 Unlock