

Question: Write a function plotexvar that will plot data points represented by the x and y vectors which are passed as the first two input arguments.
Write a function plotexvar that will plot data points represented by the x and y vectors which are passed as the first two input arguments. In other words, this function takes at least two input arguments. If a third argument is passed, it is a color, and if a fourth argument is also passed, it is a line width for the plot. Add a title to the plot to display the total number of arguments passed to the function
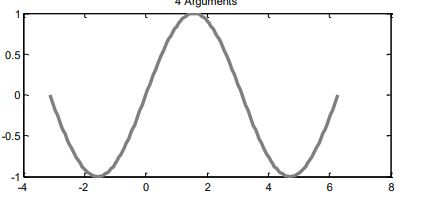
Suggestion: change the plot properties (Color, LineWidth). Here is an example of calling the function and the resulting plot: >> x=-pi:pi/50:2*pi; >> y = sin(x);
>> plotexvar(x,y, [0.5,0.5,0.5],3)
4 Aiguments 0.5 0.5 -1 -4 -2 4 8
Step by Step Solution
There are 3 Steps involved in it
1 Expert Approved Answer
Step: 1 Unlock

Question Has Been Solved by an Expert!
Get step-by-step solutions from verified subject matter experts
Step: 2 Unlock
Step: 3 Unlock