

Question: Write a JavaScript to plot histogram of user entered letters for a sentence entered by the user. Histogram is a graph that will depict frequency
Write a JavaScript to plot histogram of user entered letters for a sentence entered by the user. Histogram is a graph that will depict frequency of occurrence of user specified letters in a user specified string. You have to make use of plotly library and a sample is provided to you.
A) Create an HTML form as depicted below with two labels, two input boxes, a button and a div element. User will enter a string and a word as inputs, and you should plot the histogram in the div element on button click.
B) Create a CSS file to put your favorite styles for all the elements in the form. It should have a minimum of style shown above. You can choose colors of your likings.
C) JavaScript could be within the same html file or as an external file. The choice is again up to you.
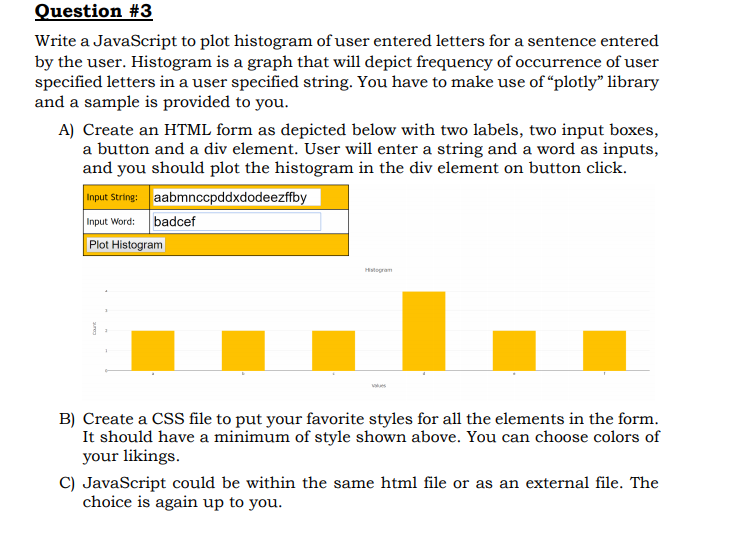
Question #3 Write a JavaScript to plot histogram of user entered letters for a sentence entered by the user. Histogram is a graph that will depict frequency of occurrence of useir specified letters in a user specified string. You have to make use of "plotly" library and a sample is provided to you A) Create an HTML form as depicted below with two labels, two input boxes, a button and a div element. User will enter a string and a word as inputs, and you should plot the histogram in the div element on button click Input String: aabmnccpddxdodeezffby Input Word: badcef Plot Histogram B) Create a CSS file to put your favorite styles for all the elements in the form. It should have a minimum of style shown above. You can choose colors of your likings C) JavaScript could be within the same html file or as an external file. The choice is again up to you. Question #3 Write a JavaScript to plot histogram of user entered letters for a sentence entered by the user. Histogram is a graph that will depict frequency of occurrence of useir specified letters in a user specified string. You have to make use of "plotly" library and a sample is provided to you A) Create an HTML form as depicted below with two labels, two input boxes, a button and a div element. User will enter a string and a word as inputs, and you should plot the histogram in the div element on button click Input String: aabmnccpddxdodeezffby Input Word: badcef Plot Histogram B) Create a CSS file to put your favorite styles for all the elements in the form. It should have a minimum of style shown above. You can choose colors of your likings C) JavaScript could be within the same html file or as an external file. The choice is again up to you
Step by Step Solution
There are 3 Steps involved in it

Get step-by-step solutions from verified subject matter experts