

Question: Write a macro in Excel that draws a bar diagram as given in the imagebased on the provided cation / anion analysis of a water
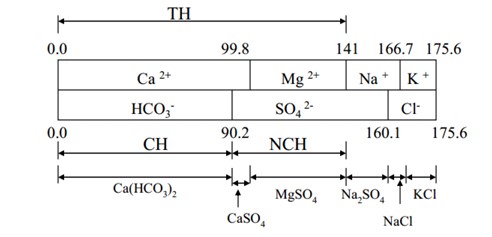
Write a macro in Excel that draws a bar diagram as given in the imagebased on the provided cationanion analysis of a water sample. The unit for the bar diagram should be mgL as CaCOL The size of the rectangular shapes should change in proportion to the concentration of each ion.
Please calculate alkalinity, carbonate hardness and noncarbonate hardness as well.
Step by Step Solution
There are 3 Steps involved in it
1 Expert Approved Answer
Step: 1 Unlock

Question Has Been Solved by an Expert!
Get step-by-step solutions from verified subject matter experts
Step: 2 Unlock
Step: 3 Unlock